Managing Risk at Commercial Bank
Scope of Risk and the Risk Management Framework
At Commercial Bank, the management of risk plays a pivotal part in all its business activities. The identification, evaluation, measurement, mitigation, monitoring and reporting of risks associated with products, processes, systems and services of the Bank is an integral part that forms the scope of risk management when fulfilling requirements of its customers and counterparties.
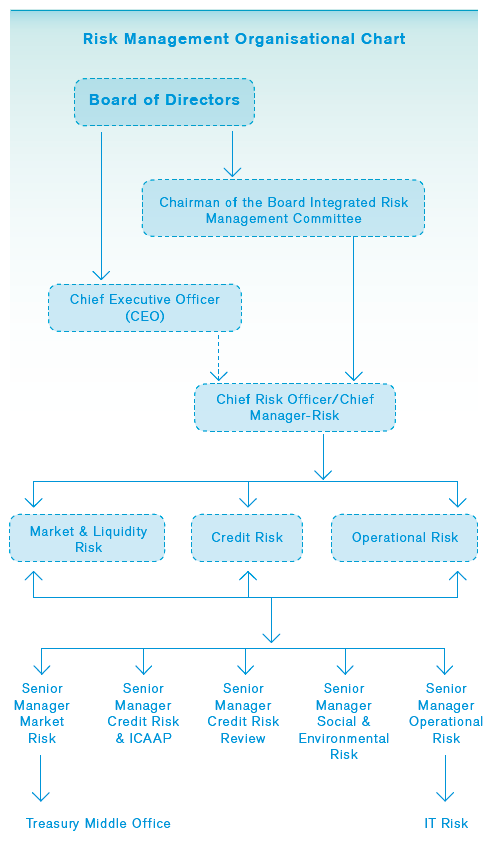
The risk management function of the Bank comes under the direct supervision of the Board Integrated Risk Management Committee (BIRMC) where its independence from the business lines is ensured. In the course of its business activities, the Bank is constantly exposed to risks that include but are not limited to Credit Risk, Market Risk, Liquidity Risk and Operational Risk. The Bank is aware of a wide spectrum of risks that it is exposed to and provides attention to each and every risk factor that could hinder the achievement of Bank’s overall objectives. The risk management function strives therefore to manage the enterprise-wide risks optimized through risk adjusted returns within the risk appetite of the Bank.
The Bank has put in place structures and processes to address these risks which are vested in different sections, officers and risk-related committees of the Bank.
Risk related committees of the Bank are listed below;
| Committees | Key Objectives | Represented by |
| Board Integrated Risk Management Committee (BIRMC) | To ensure that the Bank-wide risks are managed within the risk strategy and appetite established by the Board of Directors. | Board Integrated Risk Management Committee Report |
| Board Credit Committee(BCC) | To assist the Board to analyse and review the credit risk control measures in the lending area, evaluate and recommend high value credit proposals and comply with CBSL regulations. | Board Credit Committee Report |
| Executive Integrated Risk Management Committee (EIRMC) | To monitor and review all the risk exposures and risk-related policies and procedures affecting credit, market and operational areas in line with the directives from BIRMC. | Risk Management, Personal Banking, Corporate Banking, Treasury, Inspection/ Audit, Compliance and Finance. |
| Assets and Liabilities Committee (ALCO) | To optimise the Bank’s financial goals, while maintaining market and liquidity risks within the Bank’s risk appetite. | Treasury, Corporate Banking, Personal Banking, Risk Management and Finance |
| Credit Policy Committee | To review and approve credit policies and procedures to ensure that all credit portfolios are properly managed within the lending strategies of the Bank. | Corporate Banking, Personal Banking, Risk Management, Inspection, Recoveries and Branch Credit Monitoring. |
| Executive Committee on Monitoring NPAs | To review and monitor the Bank’s Non-performing Advances (NPAs) above Rs. 5.0 Mn. to initiate timely corrective actions to prevent and reduce credit losses. | Corporate Banking, Personal Banking, Recoveries and Risk Management. |
| Business Continuity Management Steering Committee (BCMSC) | To direct, guide and oversee the activities of the Business Continuity Plan (BCP) of the Bank which aligns with the strategic direction provided by the Board with regard to BCP development and maintenance. | Key members in the Bank’s Corporate Management covering all business lines that come under their purview. |
| Information Security Council (ISC) | To support in continuously meeting the information security objectives and requirements of the Bank. | IT, Operations, Risk Management and Inspection/Audit. |
Managing Director is a member of all above Committees except for BCMSC and ISC, while Chief Operating Officer is a member of all above committees except for ISC.
These committees carry out independent risk evaluations both qualitative and quantitative and the results are shared with Line Managers, Senior Management and Board of Directors in order to initiate mitigatory measures.
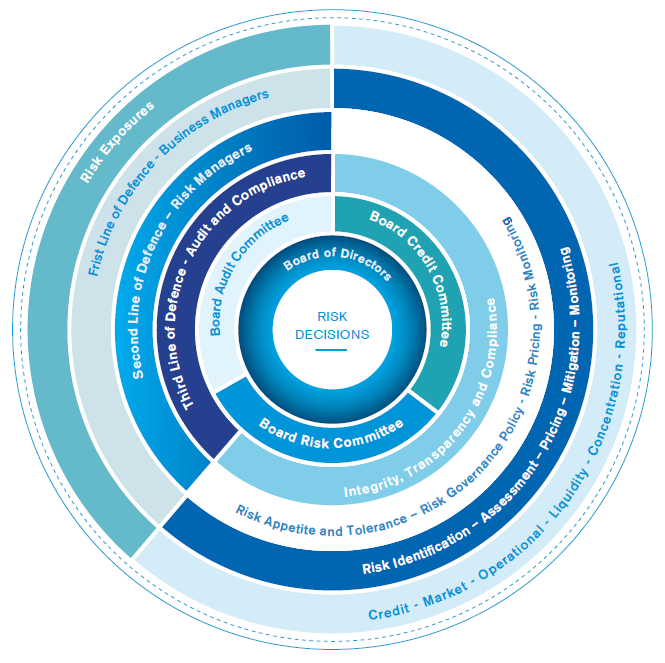
Three Lines of Defence
In achieving its goals, the Bank deploys risk management and internal control structure referred to as the ‘three lines of defence’, wherein roles between Line Management, Risk Management and Inspection/Audit are segregated.
| Line Management | Cultivates a culture of risk awareness and embed it as a part of role description for all employees. |
| Risk Management | Reviews and challenges the self-assessment of risks and controls developed by the business units and independently oversees the implementation and adherence to the policies by the Line Management. |
| Inspection/Audit | Conducts periodic and independent review of all material risks and assess the appropriateness of the internal controls. |
Risk Profile Dashboard
The Bank has established policy parameters on tolerance limits on a number of identified key risk indicators. These encompass compliance with CBSL and other regulatory frameworks as well as Bank-wide focus on targets such as capital adequacy, overall external rating, profitability and growth from a strategic perspective. Credit Risk aspects are evaluated through numerous types of concentrations and asset quality levels whereas Market Risk aspects focus on liquidity, interest rate, Foreign Exchange and concentration of products and markets. Operational Risk aspects focus on major risk types under Basel II guidelines as well as IT Risk parameters in arriving at the overall risk profile.
Aggregation and monitoring of risk tolerances ensure that the Bank operates in line with its desired overall risk profile. The overall risk appetite of the Bank will be monitored through a high-level risk appetite and tolerance dashboard for the Senior Management and the Board of Directors as well as individual dashboards for major business units.
The desired level under each indicator is being monitored against achievement on a regular basis to provide a clear perspective of the risk profile of the Bank to support taking proactive measures in achieving strategic objectives of the Bank.
Basel II Framework
The Basel II framework is built on three Pillars and the progress made by the Bank in achieving these standards are discussed below;
| First Pillar | Second Pillar | Third Pillar | |
| Concept |
Maintenance of minimum regulatory capital for credit risk, market risk and operational risk |
Supervisory review process to evaluate the activities and risk profile of the Bank to determine whether the Bank should hold higher level of capital than the minimum requirement in Pillar I. This mechanism is commonly known as ICAAP (Internal Capital Adequacy Assessment Process). |
Complements the minimum capital requirement and the supervisory review process (i.e. the first and second Pillars) by developing a set of disclosure requirements to facilitate market participants to assess the risk exposures of banks and the way in which the risks are managed. |
| Progress Made by the Bank |
Computation of capital adequacy as per regulatory requirements |
The Bank has implemented a comprehensive ICAAP framework since December, 2013 with the assistance of an overseas risk consultancy firm. |
The Bank started providing a comprehensive set of Risk Management disclosures from 2012 in line with the regulatory requirements to enhance market discipline. |
In addition to meeting the requirements stated in the Risk Management Framework prescribed by the regulator, the Bank has progressed well in implementing the International Best Practices of Risk Management by acquiring risk management software systems for credit, market and operational risks.
Basel III and Beyond
In compliance with the regulatory requirements, the Bank has initiated establishing one of the standards prescribed under Basel III Framework - Liquidity Coverage Ratio (LCR). Accordingly, test calculations are being shared with the Central Bank of Sri Lanka on a monthly basis and the Bank is confident of falling in line with the Basel III Road Map of the Regulator. In addition, the Bank is getting itself geared to embrace other salient features of Basel III requirements as and when they are to be implemented in Sri Lanka.
Bank’s Risk Appetite Framework
In volatile financial markets, it is important to understand the accurate risk profile of the Bank and compare that with the desired risk profile on an ongoing basis. The Bank therefore, has implemented a comprehensive risk appetite framework that helps to better understand and manage the risks by translating risk matrix and methods into strategic decisions, reporting and day-to-day business decisions.
Risk appetite defines the aggregate quantum of risk the Bank is willing to assume in different areas of business in achieving its strategic objectives while maintaining the desired risk profile. Tolerance limits for various types of risks such as credit risk, market risk and operational risk including IT risk has been established by the Bank and these limits are periodically reviewed to capture factors such as:
- Evolving business and strategic objectives of the Bank.
- Changing local and global economic conditions.
- Changes in regulatory requirements.
- Dynamic and competitive business environment.
- Internal budgets and forecasts.
- Behaviour of historical loss data.
- Adequacy of existing systems and controls.
A comprehensive limit system is adopted to translate the risk appetite of the Bank so that it is understandable and practical to implement, while catering to current sophisticated level of the operations.
| Risk Type | Approaches Prescribed by Basel II | Approaches Adopted by CBC | Future Plan |
| Credit Risk |
Basel Accord prescribes three approaches of increasing sophistication:
|
Presently the Bank follows the Standarised Approach in calculating the capital requirement for Credit Risk. |
The Bank is in the process of migrating to Basel II advanced approaches in measuring Credit Risk for capital calculations. |
| Market Risk |
Basel II allows two approaches for determining capital requirement for Market Risk
|
The Bank currently follows the Standardised Approach in estimating the minimum capital requirement for its Market Risk exposures. | The Bank commenced calculating Market Risk VaR at portfolio level. This will pave the path for the Bank to progress towards Internal Models Approach in calculating the capital requirement for Market Risk |
| Operational Risk |
The Operational Risk capital could be calculated under three approaches;
b. Alternative Standardised Approach (ASA) |
The Bank currently adopts the Basic Indicator Approach in estimating the Operational Risk capital requirements. |
The Bank is in the process of migrating to TSA while due consideration is being given to ASA. Further, the Bank also commenced collecting data and fulfilling other requirements for AMA, with the implementation of Operational Risk Management software system. |
Pillar I Capital Calculation
Capital Adequacy Computation – Group
| As at December 31, |
2014 Rs. ’000 |
2013 Rs. ’000 |
1. Capital Adequacy Ratios |
||
1.1 Core Capital Ratio |
||
| Total Eligible Core Capital (Tier l Capital) (Refer Note 2.1) | 58,662,124 | 51,649,064 |
| Total Risk-Weighted Assets (Refer Note 3) | 448,906,025 | 388,384,247 |
| Total Eligible Core Capital (Tier l Capital) (Minimum Requirement 5%) (%) | 13.07 | 13.30 |
1.2 Total Capital Ratio |
||
| Total Capital Base (Refer Note 2.2) | 72,832,325 | 65,747,955 |
| Total Risk-Weighted Assets (Refer Note 3) | 448,906,025 | 388,384,247 |
| Total Capital Ratio (Minimum Requirement 10%) (%) | 16.22 | 16.93 |
2. Computation of Capital |
||
2.1 Computation of Eligible Core Capital (Tier l Capital) |
||
| Paid-up Ordinary Shares/Common Stock/Assigned Capital | 21,457,501 | 19,586,813 |
| Statutory Reserve Fund | 4,327,103 | 3,768,094 |
| Published Retained Profits/(Accumulated Losses) | 1,667,087 | 1,642,360 |
| General and Other Reserves | 32,020,287 | 27,092,271 |
| Minority Interests (consistent with the above capital constituents) | 47,564 | 38,778 |
| Less: Deductions/Adjustments | ||
| Goodwill | 400,045 | – |
| Other intangible assets | 456,185 | 477,728 |
| Advances granted to employees of the Bank for the purchase of shares of the Bank (ESOP) | 786 | 1,122 |
| 50% of Investments in Unconsolidated Banking and Financial Subsidiary Companies | – | – |
| 50% Investments in the Capital of Other Banks and Financial Institutions | 402 | 402 |
| Total Eligible Core Capital (Tier I Capital) | 58,662,124 | 51,649,064 |
2.2 Computation of Total Capital Base (Regulatory Capital) |
||
| Total Eligible Core Capital (Tier I Capital) (Refer Note 2.1 above) | 58,662,124 | 51,649,064 |
| Supplementary Capital | ||
| Revaluation Reserves (as approved by Central Bank of Sri Lanka) | 2,034,231 | 2,034,231 |
| General Provisions | 1,836,058 | 1,656,465 |
| Approved Subordinated Term Debt | 10,300,314 | 10,408,596 |
| Less: Deductions/Adjustments | ||
| 50% of Investments in Unconsolidated Banking and Financial Subsidiary Companies | – | – |
| 50% Investments in the Capital of Other Banks and Financial Institutions | 402 | 402 |
| Total Capital Base | 72,832,325 | 65,747,955 |
| As at December 31, |
2014 Rs. ’000 |
2013 Rs. ’000 |
3. Computation of Risk-Weighted Assets - RWA |
||
Credit Risk |
||
| RWA of On-balance sheet assets (Refer Note 4.1) | 357,895,337 | 312,948,832 |
| RWA of Off-balance sheet assets (Refer Note 4.2) | 36,624,440 | 29,150,668 |
| Total RWA for Credit Risk (a) | 394,519,777 | 342,099,500 |
Market Risk |
||
| Capital Charge for Interest Rate Risk | 525,669 | 290,331 |
| Capital Charge for Equity | 70,347 | 63,000 |
| Capital Charge for Foreign Exchange & Gold | 123,188 | 177,955 |
| Total Capital Charge for Market Risk | 719,204 | 531,286 |
| Total RWA for Market Risk (Total Capital Charge for Market Risk x 10) (b) | 7,192,045 | 5,312,861 |
Operational Risk |
||
| Gross Income | ||
| Year 1 | 32,989,114 | 23,166,112 |
| Year 2 | 24,964,114 | 25,763,771 |
| Year 3 | 36,435,177 | 33,013,888 |
| Average Gross Income | 31,462,802 | 27,314,590 |
| Total Capital Charge for Operational Risk - (Average Gross Income x 15%) | 4,719,420 | 4,097,189 |
| Total RWA for Operational Risk - (Total Capital Charge for Operational Risk x 10) (c) | 47,194,203 | 40,971,886 |
| Total Risk-Weighted Assets (a+b+c) | 448,906,025 | 388,384,247 |
4. Computation of RWA of On-Balance sheet and Off-Balance Sheet Assets
4.1. Computation of RWA of On-Balance Sheet Assets
| As at December 31, | 2014 | 2013 | |||
|
Risk-weight Factor |
On-Balance Sheet Assets |
Risk-weighted Assets |
On-Balance Sheet Assets |
Risk-weighted Assets |
|
| % | Rs. ’000 | Rs. ’000 | Rs. ’000 | Rs. ’000 | |
| Claims on Government of Sri Lanka and Central Bank of Sri Lanka | 0 | 296,402,175 | – | 186,224,330 | – |
| Claims on Foreign sovereigns and their Central Banks | 0-150 | 14,474,568 | 14,474,568 | 13,013,457 | 13,013,457 |
| Claims on Public Sector Entities (PSEs) | 20-150 | 2,001,386 | 2,001,386 | 1,106,695 | 1,106,695 |
| Claims on Banks | 0-150 | 22,000,718 | 9,123,717 | 7,431,018 | 3,171,564 |
| Claims on Financial Institutions | 20-150 | 6,717,256 | 2,595,421 | 3,483,253 | 1,421,616 |
| Claims on Corporates | 20-150 | 180,382,044 | 163,169,705 | 201,017,165 | 189,954,336 |
| Retail claims | 75-100 | 128,387,920 | 106,252,471 | 63,087,735 | 47,321,629 |
| Claims Secured by Residential Property | 50-100 | 34,128,075 | 27,615,834 | 31,696,981 | 26,829,841 |
| Non-performing Assets (NPAs) | 50-150 | 7,673,647 | 10,687,124 | 7,731,921 | 10,914,776 |
| Cash Items | 0-20 | 13,678,575 | 950 | 11,514,318 | 854 |
| Property, Plant & Equipment | 100 | 11,243,805 | 11,243,805 | 9,285,554 | 9,285,554 |
| Other Assets | 100 | 10,730,355 | 10,730,355 | 9,928,510 | 9,928,510 |
| Total | 727,820,525 | 357,895,337 | 545,520,938 | 312,948,832 | |
4.2. Computation of RWA of Off-Balance Sheet Assets
| As at December 31, | 2014 | 2013 | |||
|
Risk-weight Factor |
Principal Amount of Off-Balance Sheet Assets |
Risk-Weighted Assets (*) |
Principal Amount of Off-Balance Sheet Assets |
Risk-Weighted Assets (*) |
|
| % | Rs. ’000 | Rs. ’000 | Rs. ’000 | Rs. ’000 | |
| Claims on Banks | 0-150 | ||||
| (a) Foreign Exchange Contracts | 110,163,778 | 1,478,510 | 104,154,205 | 1,505,166 | |
| i. Original Maturity-less than one year | 110,163,778 | 1,478,510 | 104,154,205 | 1,505,166 | |
| Claims on Corporates | 20-150 | ||||
| (a) Direct Credit Substitutes | 19,339,591 | 18,094,265 | 16,529,443 | 13,981,424 | |
| i. General Guarantees of Indebtedness | 19,339,591 | 18,094,265 | 16,529,443 | 13,981,424 | |
| (b) Transaction-related Contingencies | 9,655,456 | 4,825,310 | 9,678,648 | 4,529,379 | |
| i. Performance Bonds, Bid Bonds & Warranties | 9,650,119 | 4,822,641 | 9,678,648 | 4,529,379 | |
| ii. Others | 5,337 | 2,669 | – | – | |
| (c) Short-Term Self-Liquidating Trade-Related Contingencies | 44,215,017 | 8,725,516 | 39,474,904 | 7,409,905 | |
| i. Shipping Guarantees | 2,042,463 | 386,509 | 1,621,825 | 192,981 | |
| ii. Documentary Letters of Credit | 19,629,284 | 3,830,353 | 20,059,254 | 3,658,159 | |
| iii. Trade related acceptances | 1,663,030 | 332,606 | – | – | |
| iv. Others | 20,880,240 | 4,176,048 | 17,793,825 | 3,558,765 | |
| (d) Foreign Exchange Contracts | 19,457,853 | 374,013 | 30,850,547 | 479,518 | |
| i. Original Maturity-less than one year | 19,259,628 | 364,102 | 30,850,547 | 479,518 | |
| ii. Original Maturity-More than one year and less than Two years | 198,225 | 9,911 | – | – | |
| Retail claims | 75-100 | ||||
| (a) Direct Credit Substitutes | 5,220,140 | 1,840,022 | 2,604,851 | 902,476 | |
| i. General Guarantees of Indebtedness | 5,220,140 | 1,840,022 | 2,604,851 | 902,476 | |
| (b) Transaction-related Contingencies | 2,387,898 | 454,785 | 1,157,244 | 221,400 | |
| i. Performance Bonds, Bid Bonds & Warranties | 2,387,898 | 454,785 | 1,157,244 | 221,400 | |
| (c) Short-Term Self-Liquidating Trade-Related Contingencies | 5,785,464 | 832,019 | 1,084,871 | 121,400 | |
| i. Shipping Guarantees | 128,185 | 17,394 | 131,287 | 11,391 | |
| ii. Documentary Letters of Credit | 5,657,279 | 814,625 | 953,584 | 110,009 | |
| Other Commitments with an Original maturity of up to one year or which can be unconditionally cancelled at any time | 0 | 97,266,455 | – | 68,984,511 | – |
| Undrawn Term Loans | 15,766,856 | – | 7,840,263 | – | |
| Undrawn Overdraft Facilities/Unused Credit Card Lines | 56,599,992 | – | 46,409,303 | – | |
| Others | 24,899,607 | – | 14,734,945 | – | |
| Total | 313,491,652 | 36,624,440 | 274,519,224 | 29,150,668 | |
(*) Risk weighted figures of Off Balance Sheet assets are arrived at after using Credit Conversion Factors (CCF) prescribed under Basel II guidelines issued by the Central Bank of Sri Lanka and net of cash securities.
The Bank has used the following External Credit Assessment Institutions (ECAI) in the standardised approach for credit risk.
- Fitch Ratings Lanka Ltd.
- Lanka Rating Agency Ltd.
- Moody’s
- Standard & Poor’s
- ICRA Lanka Ltd.
There have been no changes in the ECAIs used during the Reporting period. The Bank has used the standard mapping published by the Regulator.
CREDIT RISK
1. Overview
Credit Risk is the potential loss that could arise when a counterparty or borrower fails to meet its obligations under a contract. Though a credit risk arises mainly from direct lending reflected as ‘On-Balance Sheet’ transactions, it could also arise from ‘Off-Balance Sheet’ transactions such as Letters of Credit, Guarantees, Documents Against Acceptance etc. A deterioration of counterparty credit quality and/or market volatility can lead to potential credit risk related losses for the Bank. This will not only affect the profitability of the Bank but also could deteriorate the overall credit risk profile of the Bank.
2. Management Process
The Bank has a well-structured credit risk management process that involves assessing, quantifying, monitoring, pricing and mitigating credit risk exposures in line with the established policy framework which has been approved by the Board of Directors.
The Credit Risk Management Framework includes comprehensive policies, procedures including well-defined approval hierarchy and different committees to address various aspects of the credit risk management process in order to maintain the quality of the credit portfolio of the Bank.
The policies ensure quality, consistency and transparency in the credit risk approvals at all times. They also promote a disciplined credit culture in the Bank firmly embedded into high ethical standards.
The Bank considers the credit risk management as a value enhancing activity that goes beyond regulatory compliance. Therefore risk optimisation, a sound credit approval process based on highest ethical standards, an appropriate credit administration, measurement and monitoring process and adequate controls over credit risk on a continuous basis are made essential components of same.
The Board of Directors has approved the hierarchy for granting credit approvals. The exposures beyond certain predetermined levels require independent risk evaluation and final risk sign off before sanctioning. The Bank also has a robust post approval monitoring function of its credit portfolio.
3. Credit Risk Appetite
The Board of Directors set the credit risk appetite of the Bank in order to manage the credit risk, where limits on maximum exposures to industry sectors, products and geographies are defined after a thorough qualitative and quantitative assessment. The Credit Policy and the Lending Guidelines of the Bank have documented the credit risk appetite. The Bank has classified the sectors which are of limited appeal or of no credit appetite into two main categories; i.e.‘High Risk’ and ‘Prohibited Appetite’. While proposals coming under ‘High Risk’ category are approved only under exceptional circumstances with a strong business rationale and with adequate risk mitigants, the proposals falling under ‘Prohibited Appetite’ category are not entertained at all.
Bank has introduced a comprehensive and robust risk rating system compliant with Basel II guidelines. It is capable of representing diverse risk factors through a single point of indicator and predicting the ‘Probability of Default’ (PD) based on borrower and transaction specific criteria. These indicators complement Lending Officers to measure the risk profile of the credit portfolios in an objective manner, while supporting the Bank’s endevours in the direction of progressing from the present Basel II Standardised Approach towards more advanced Internal Rating Based (IRB) approach.
Bank’s general policy is to assume credit exposures with short to medium term maturities. This reduces the overall credit risk in the portfolios, to a great extent. The overall credit risk exposure on certain risk categories (i.e. single borrower, industry sectors, products etc.) are monitored and controlled through a set of prudential exposure limits established by the Board of Directors.
4. Functionalities of Credit Risk Management
Credit risk management comprises of three main functional components namely, Credit Risk Management, Credit Risk Review and the Environmental Risk Review. While the Credit Risk Management evaluates proposals at the pre-sanction stage, the Credit Risk Review Function assesses the proposals at post-sanction stage.
Environmental Risk Review Function plays a role at both pre- and post-sanction stages to ensure that the Bank’s lending activities are in conformity with the Bank’s ‘Social and Environmental Management System (SEMS)’ Policy. Bank’s social and environmental risks arise from its customers due to the inherent nature of operations of those customers. These risks are not static but rather dynamic and subject to change over time. SEMS framework ensures that all projects financed by the Bank are designed, built, operated and maintained in a manner consistent with the requirements of SEMS and the borrowing firms understand, agree and are able to comply with same. It also ensures that transparency is maintained in all social and environmental related activities. The integration of SEMS into the credit evaluation process ensures the due consideration is given for environmental and social aspects which not only enriches the credit culture of the Bank but also contributes in preserving the social and environmental aspects of the society at large.
5. Credit Risk Mitigation and Monitoring
Lending Officers are primarily entrusted with timely recovery of the advances granted. Advances with potential vulnerabilities which require close monitoring or improved risk mitigants are duly identified with the assistance of the Branch Credit Monitoring Unit. Meanwhile, the Key Credit Risk Indicators (KCRIs) which include the loans and advances segmentation by business lines and products, risk rating, economic sectors, exposures, analysis of NPL portfolio and default ratios, analysis of high risk segments, concentration and cross border exposures etc. are prepared on a monthly basis. Credit Risk Management Function analyzes the risks of the overall credit portfolio of the Bank in an objective manner, comparing same against established policy parameters to ensure an effective credit risk monitoring mechanism.
At portfolio level, the Bank monitors the advances at the highest possible granularity to effectively capture portfolio characteristics and possible correlations between portfolios and environmental factors. Further, the Bank tracks the quality of the loan book on a regular basis by analysing the trends in different lending portfolios. This process also enables the Bank to identify any emerging risks in the individual credit portfolios and to take suitable, timely corrective actions. Another main focus of credit portfolio management process is to derive the maximum benefit associated with the diversification of the Bank’s advances portfolio into thriving economic segments, whilst reducing the overall credit concentration and optimising returns.
Credit Risk Management Unit (CRMU) of the Integrated Risk Management Department (IRMD) makes recommendations for suitable amendments if required, after reviewing the existing credit policy framework. CRMU independently verifies that the proposals with exposures above identified threshold levels fall within the established credit risk framework of the Bank and that they are in compliance with the internal as well as regulatory requirements.
Internal Audit Function ensures that the Credit Risk Management Function is properly carried out through an independent review.
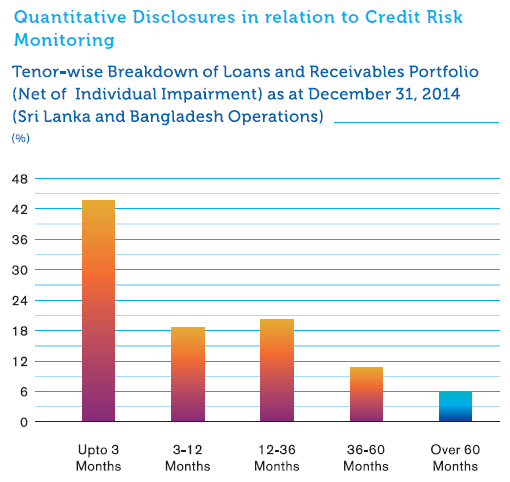
Quantitative Disclosures in relation to Credit Risk Monitoring
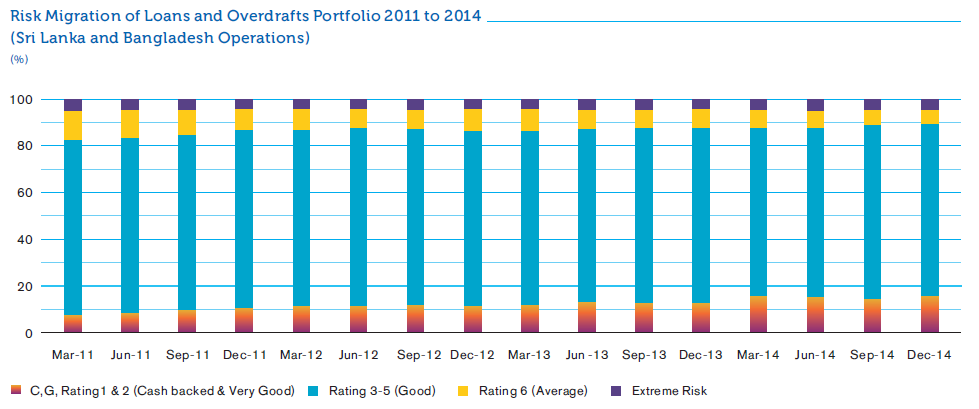
Risk Migration of Loans and Overdrafts Portfolio 2011 to 2014
(Sri Lanka and Bangladesh Operations)
Approximately 90% of the advances portfolio is above Risk Rating 5 (i.e. Better than average).
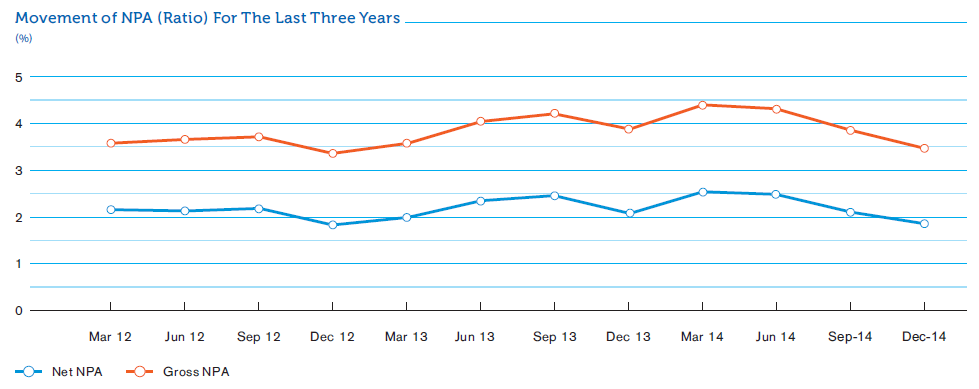
Movement of NPA (Ratio) For The Last Three Years
Both Gross and Net NPA have recorded a downward trend from the second quarter of the year and have ended on an improved position compared to the 4th quarter of 2013.
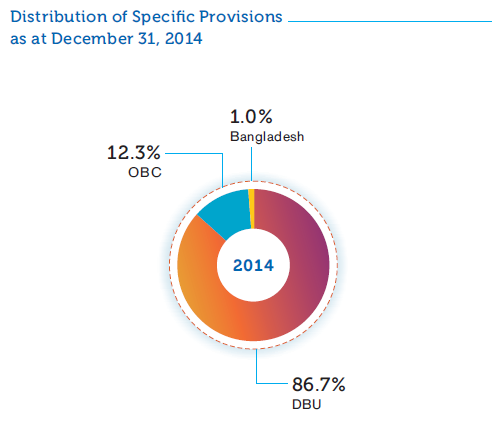
Distribution of Specific Provisions as at December 31, 2014
Bulk of the specific provisions have been made on account of borrowers of Sri Lankan Domestic Banking Unit operation corresponding to the active size of the portfolio.
As a prudent measure, the Bank adopts internal policies which are at times more stringent than the regulatory requirements where the Non-Performing Advances portfolio is concerned.
On identified exposures the Bank takes a more stringent approach than the Regulator on Specific Provisions, Haircut Provisions and Special Provisions.
Segmentation of NPA Portfolios as at December 31, 2014 by Industry Sector (Sri Lanka Operation).
| Industry Sector |
Outstanding Rs. Mn. |
Specific Provision Rs. Mn. |
Amount Written-Off Rs. Mn. |
| Exports | 977.33 | 325.39 | 19.69 |
| Imports | 2,298.06 | 700.82 | 51.09 |
| Wholesale and Retail Trading | 985.52 | 396.49 | 10.37 |
| Construction Industry | 1,750.85 | 284.47 | 2.11 |
| Industrial | 2,091.08 | 732.80 | 47.53 |
| Agriculture | 928.43 | 536.71 | 21.73 |
| Housing | 444.29 | 209.51 | 0.44 |
| Tourism and allied | 1,083.95 | 849.55 | 0.69 |
| Personal | 3,239.29 | 1,797.09 | 50.19 |
| Services | 1,150.51 | 431.24 | 17.18 |
| Holding companies | 5.44 | 3.08 | – |
| Non-Banking financial institutions | 47.75 | 28.07 | – |
| State institutions | 0.02 | – | – |
| Any other commercial activity | 575.22 | 220.92 | 4.99 |
| Miscellaneous | 265.13 | 85.08 | 1.11 |
| Total | 15,842.89 | 6,601.23 | 227.11 |
Note: The above figures have been prepared based on SLAS and may differ from SLFRS figures.
Segmentation of NPA Portfolio as at December 31, 2014 by Geographic Area (Sri Lanka and Bangladesh Operations).
| Province |
Total NPA Rs. Mn. |
Specific Provisions for Bad Debts Rs. Mn. |
General Provision Rs. Mn. |
| Central Province | 615.17 | 280.08 | 75.69 |
| Eastern Province | 220.34 | 118.43 | 12.16 |
| North Central Province | 481.20 | 195.50 | 22.81 |
| Northern Province | 829.60 | 443.69 | 18.39 |
| North Western Province | 1,294.08 | 528.27 | 75.70 |
| Sabaragamuwa Province | 446.27 | 182.44 | 37.81 |
| Southern Province | 1,647.97 | 701.49 | 87.11 |
| Uva Province | 190.24 | 68.64 | 22.72 |
| Western Province | 10,118.01 | 4,082.70 | 1,397.29 |
| Bangladesh | 652.36 | 65.23 | 86.39 |
| Maldives | – | – | – |
| Other Foreign Geographies | – | – | – |
| Total | 16,495.25 | 6,666.47 | 1,836.07 |
Note: The above figures have been prepared based on SLAS and may differ from SLFRS figures.
Concentration Risk
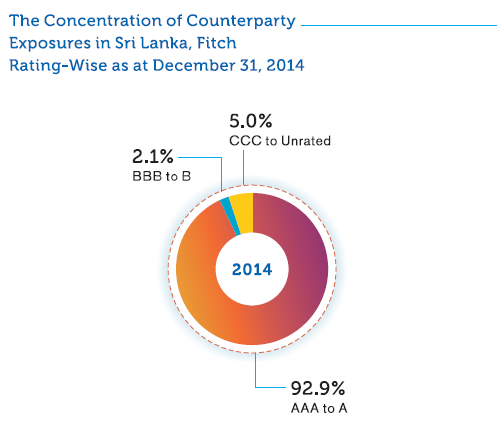
Counterparty Exposures
The Bank has laid down policies and procedures to manage the credit risk on local and foreign counterparty banks including a comprehensive set of limits. These exposures to counterparty banks are monitored at frequent intervals against the established prudent limits as well as market information on the financial and/or economic performance of these counterparties. The concentration levels on the said limits are closely monitored by the Credit Risk Management Unit and the exposures are reported to the Senior Management and Board Committees on a regular basis. Exposure limits are reduced, suspended or cancelled upon adverse market information that might hamper performance of a counterparty bank.
The Concentration of Counterparty Exposures in Sri Lanka, Fitch Rating-Wise as at December 31, 2014
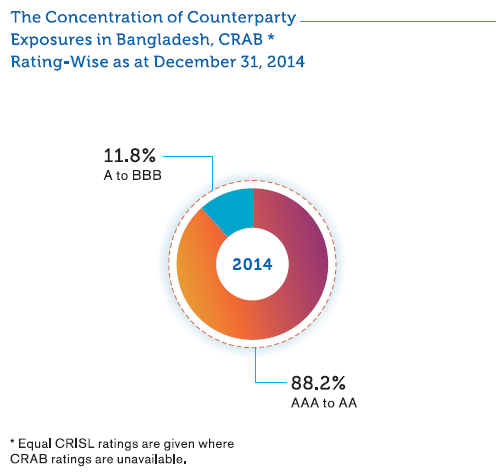
The Concentration of Counterparty Exposures in Bangladesh, CRAB* Rating-Wise as at December 31, 2014
The Bank in its normal course of business strives to deal with other local banks (counterparties) with high International credit ratings in order to minimise risk on its exposures.
A similar approach is adopted in managing the counterparty risk in Bangladesh as well.
The Bank had not encountered any counterparty bank default locally or overseas during 2014.
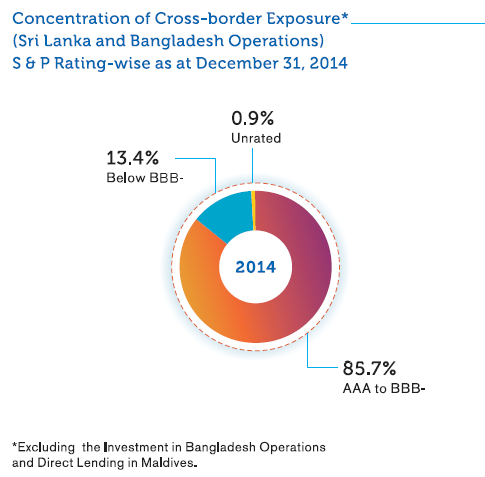
Cross-Border Exposures
In addition to counterparty exposures, the Bank is also exposed to cross-border risks - the risk that Bank will be unable to obtain payment from its customers or third parties on their contractual obligations as a result of certain actions taken by foreign governments, mainly relating to convertibility and transferability of foreign currency.
Cross-border assets comprise of loans and advances, interest-bearing deposits with other banks, trade and other bills and acceptances which predominantly relate to short-term money market activities.
Cross-border exposures are subjected to a limit structure to minimise risk arising from over concentration and possible settlement risk. Selection of counterparties has been carried out using stringent evaluation and imposing different threshold levels to facilitate monitoring and timely action to suspend limits to countries due to global economic and/or political developments when necessary.
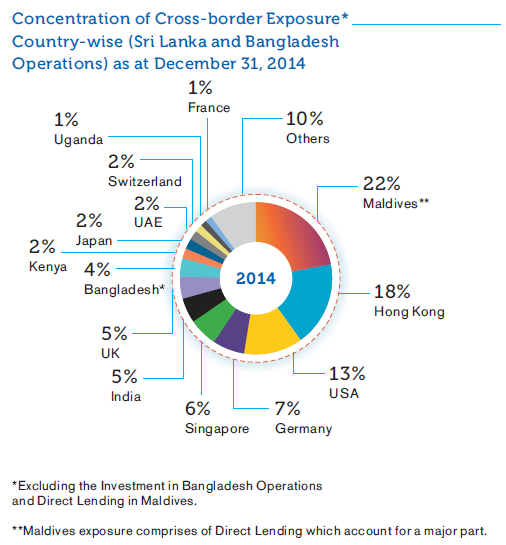
The Bank has exposure to country risk through a spread of counterparties based across the globe. The Bank keeps a vigilant watch on the developments that might have an impact on settlement of its exposures and relies on independent risk ratings as a criterion for evaluating cross-border risk.
The high level of cross-border exposures to Hong Kong, USA, Germany and Singapore reflects the intensity in our transactions with counterparties in these countries.
Collateral Management and Valuation
The primary source of repayment of credit exposures is the cash flows while the collaterals obtained by the Bank act as a possible secondary recourse. Collateral generally include cash, marketable securities, properties, stocks, trade debtors, other receivables machinery and equipment and other physical or financial assets.
Clear guidelines are in place to determine the suitability of collateral in credit risk mitigation based on their different characteristics and for valuation, to ensure the collaterals will continue to provide the anticipated secondary source of repayment in an eventuality. The Bank has a panel of appointed professional valuers in order to obtain valuation of the properties, machinery and vehicles obtained as collaterals against credit exposures.
Periodic estimation of values of collateral ensures that they will continue to provide the expected repayment source in an event where the primary source has not materialised. The collaterals vulnerable to frequent fluctuations in values are subject to stringent haircuts and/ or more frequent valuations.
The Bank also accepts personal and/or corporate Guarantees, Guarantees from other banks and credit-worthy bodies as collateral for credit facilities. The financial strength of guarantors as against their cash flows, net worth, etc. is taken into consideration to establish their capacity to repay the facilities in case of a default.
MARKET RISK
1. Overview
Market risk is the potential of an adverse impact on Bank’s earnings or capital due to changes in interest rates, foreign exchange rates, commodity prices or equity and debt prices. During the normal course of its business, Bank deals in financial products such as loans, deposits, securities, short-term borrowings, long-term debt etc., to facilitate both customer-driven and proprietary transactions which expose the Bank to market risk in varying degrees.
2. Management Process
Risk Management Framework of the Bank ensures the appropriate management of the market risks within the overall risk appetite so that adverse changes in market risk parameters, do not materially impact the Bank’s profitability, capital or the risk profile.
Upon recognising various sources of risks, their characteristics and possible outcomes resulting from transactions undertaken by the Bank, Market Risk Management process functions in compliance with the Board approved Market Risk Management Policy.
In addition, policies such as Asset and Liability Management (ALM) Policy, Foreign Exchange (FX) Risk Management Policy, Derivative Policy, Treasury Policy and Stress Testing Policy also define exposure limits and procedures within which such transactions are required to be undertaken. Market risk limits set out in the above policies are regularly reviewed by Asset and Liability Management Committee (ALCO) and Executive Integrated Risk Management Committee (EIRMC). In addition to limits, Management Actions Triggers (MATs) are also in place either at portfolio level or at risk factor level. Bank uses a range of techniques including sensitivity analysis, stress testing, marking-to-market and Value-at-Risk (VaR) calculations to assess market risk across portfolios.
ALCO is the core management committee that regularly monitors market risk exposures and initiates appropriate action to optimise overall market risk exposures within the overall risk appetite of the Bank. In this regard, the major functions carried out by ALCO include:
- proactive managing of liquidity risk profile of the Bank,
- articulating interest rate review of the Bank and deciding on future business strategies and pricing,
- maintaining an appropriate Balance Sheet mix to suit the current market and potential trends, competition and the Bank’s strategies,
- monitoring asset and liability gaps, and rate shock results on Net Interest Income (NII) to initiate appropriate measures such as changing interest rate structure of the Balance Sheet, launching suitable long-term and short term products and improving funding policies.
3. Functionalities of Market Risk Management
The Market Risk Management governance structure is based on the understanding that each Business Head is responsible for the detection and verification of market risk sources, i.e. events, causes and consequences in relation to their business line. Market Risk Management Unit (MRMU) of the IRMD is responsible for coordinating and performing daily Market Risk Management activities including measuring, monitoring and reporting of market risk exposures, and reviewing Bank’s market risk related policies and exposure limits at least annually. It also provides independent reviews on market risks associated with new investment proposals and products, thus facilitating efficient decision-making through optimising risk-return trade off.
Treasury Middle Office (TMO) is an integral part of MRMU and functions independently from both the Treasury Front Office (i.e. trading unit) and Treasury Back Office (i.e. settlement unit). TMO independently monitors, measures and analyses market risk exposures as per the comprehensive limit framework pertaining to Treasury transactions. Further it reports on MATs, which alert of imminent limit breaches and recurring loss events, to initiate preventive measures to mitigate potential losses.
In addition the Bank conducts stress testing on market risk factors monthly, quarterly or on need basis to estimate potentially significant future losses that might arise from extreme market moves or scenarios. Such results provide Senior Management with a clear perspective of how resilient the Bank is to sudden plausible market changes.
4. Market Risk Mitigation and Monitoring
During the year 2014, the Bank did not have any exposure to commodity related price risk and only a negligible exposure on equity and debt price risk which was less than 1.6% of the total risk weighted exposure for market risk. Therefore, market risk exposure was measured mainly in terms of Interest Rate Risk (IRR) and Foreign Exchange (FX) Risk.
INTEREST RATE RISK (IRR)
IRR is the exposure of the Bank’s financial condition against movements in interest rates. Extreme down side movements in interest rates could pose a severe threat to the Bank’s Net Interest Income and also affect the underlying value of assets, liabilities and Off-Balance Sheet items. The main types of IRR to which the Bank is exposed to are re-pricing risk, yield curve risk and basis risk.
Re-pricing risk occurs due to differences in amounts of assets and liabilities getting re-priced at the same time or due to timing differences in the fixed rate maturities and appropriately re-pricing of floating rate assets, liabilities and Off-Balance Sheet instruments. Bank monitors this risk through internally set re-pricing gap limits and interest rate sensitivity limits on a regular basis.
Yield curve risk arises due to unanticipated changes in shape and gradient of the yield curve, while basis risk arises due to differences in the relative movement of rate indices used for pricing instruments with similar characteristics, both of which contribute to IRR of the Bank. These risks are managed by appropriately re-balancing and/or re-pricing portfolios.
The IRR of the Bank is measured independently and managed by Treasury in a consolidated manner through Funds Transfer Pricing (FTP) mechanism under the guidance of ALCO.
The Bank uses several tools such as gap analysis (income perspective) and duration analysis (value perspective) to monitor IRR on an ongoing basis taking into consideration re-pricing characteristics of all assets and liabilities of the Bank’s Balance Sheet. The Bank assesses IRR exposure based on both the Earnings at Risk (EAR) approach focusing on the impact of interest rate changes on its near-term earnings and the Economic Value of Equity (EVE) approach, focusing on the value of the Bank’s net cash flows.
Market Risk Portfolio Analysis
Interest Rate Sensitivity Gap Analysis of Assets and Liabilities [Sri Lanka and Bangladesh Operations]
|
Up to 1 Month Rs. Mn. |
1-3 Months Rs. Mn. |
3-6 Months Rs. Mn. |
6-12 Months Rs. Mn. |
1-3 Years Rs. Mn. |
3-5 Years Rs. Mn. |
Over 5 Years Rs. Mn. |
Non- Sensitive Rs. Mn. |
Total Rs. Mn. |
|
| Cash on Hand | – | – | – | – | – | – | – | 13,266 | 13,266 |
| Deposits with Central Banks | 167 | – | – | – | – | – | – | 19,467 | 19,634 |
| Balances due from Head Office, Affiliates and Own Branches | – | – | – | – | – | – | – | – | – |
| Balances due from Other Banks | 21,123 | 198 | 1,057 | – | – | – | – | – | 22,378 |
| Investments | 51,577 | 11,660 | 21,082 | 22,740 | 34,469 | 73,045 | 51,277 | 2,435 | 268,285 |
| Bills of Exchange | 7,342 | – | – | – | – | – | – | – | 7,342 |
| Overdrafts | 44,753 | 10,144 | 3,325 | 7,641 | 3 | – | – | – | 65,866 |
| Loans and Advances | 154,285 | 28,293 | 26,203 | 55,909 | 39,692 | 19,706 | 7,193 | – | 331,281 |
| NPLs | – | – | – | – | – | – | – | 1,391 | 1,391 |
| Fixed Assets | – | – | – | – | – | – | – | 10,392 | 10,392 |
| Net Inter-Branch Transactions | – | – | – | – | – | – | – | – | – |
| Accrued Interest | – | – | – | – | – | – | – | – | – |
| Other Assets | – | – | – | – | – | – | – | 10,788 | 10,788 |
| Reverse Repos | 32,502 | 7,521 | 1,175 | – | – | – | – | – | 41,198 |
| FRAs | – | – | – | – | – | – | – | – | – |
| SWAPs | – | – | – | – | – | – | – | – | – |
| Futures | – | – | – | – | – | – | – | – | – |
| Options | – | – | – | – | – | – | – | – | – |
| Others | – | – | – | – | – | – | – | – | – |
| Total | 311,749 | 57,816 | 52,842 | 86,290 | 74,164 | 92,751 | 58,470 | 57,739 | 791,821 |
| Demand Deposits | – | – | – | – | – | – | – | 48,960 | 48,960 |
| Savings Deposits | 198,607 | – | – | – | – | – | – | – | 198,607 |
| Time Deposits | 47,471 | 68,285 | 50,383 | 80,832 | 11,311 | 6,261 | 8,578 | – | 273,121 |
| Other Deposits | – | – | – | – | – | – | – | – | – |
| Balances due to Head Office, Affiliates and Own Branches | – | – | – | – | – | – | – | – | – |
| Balances due to Other Banks | 18,071 | 89 | 3,304 | 1,322 | – | – | – | – | 22,786 |
| Certificate of Deposits | 326 | 24 | 23 | 101 | 247 | 53 | – | – | 774 |
| Other Borrowings | 2,660 | 6,921 | 584 | 376 | 674 | – | 310 | – | 11,525 |
| Net Inter-Branch Transactions | – | – | – | – | – | – | – | – | – |
| Bills Payable | – | – | – | – | – | – | – | – | – |
| Interest Payable | – | – | – | – | – | – | – | 16,107 | 16,107 |
| Provisions (Others) | – | – | – | – | – | – | – | – | – |
| Capital | – | – | – | – | – | – | – | 21,458 | 21,458 |
| Reserves | – | – | – | – | – | – | – | 31,827 | 31,827 |
| Retained Earnings | – | – | – | – | – | – | – | 15,239 | 15,239 |
| Subordinated Debt | 9,911 | – | – | – | 972 | – | – | – | 10,883 |
| Other Liabilities | – | – | – | – | – | – | – | 13,612 | 13,612 |
| Repos | 68,592 | 17,547 | 22,349 | 16,564 | 1,870 | – | – | – | 126,922 |
| FRAs | – | – | – | – | – | – | – | – | – |
| Futures | – | – | – | – | – | – | – | – | – |
| SWAPs | – | – | – | – | – | – | – | – | – |
| Options | – | – | – | – | – | – | – | – | – |
| Total | 345,638 | 92,866 | 76,643 | 99,195 | 15,074 | 6,314 | 8,888 | 147,203 | 791,821 |
| Period Gap | (33,889) | (35,050) | (23,801) | (12,905) | 59,090 | 86,437 | 49,582 | – | – |
| Cumulative Gap | (33,889) | (68,939) | (92,740) | (105,645) | (46,555) | 39,882 | 89,464 | – | – |
| RSA/RSL | 0.90 | 0.62 | 0.69 | 0.87 | 4.92 | 14.69 | 6.58 | – | – |
The above gap report is prepared by stratifying Rate Sensitive Assets (RSA), Rate Sensitive Liabilities (RSL), and Off-Balance Sheet items into various time bands according to maturity (if fixed rates) or time remaining to their next re-pricing (if floating rate). The gap between RSA and RSL indicates the vulnerabilities the Bank is exposed to with changing interest rate scenarios in the market.
Impact on NII due to rate shocks on LKR and FCY is continuously monitored to ascertain the Bank’s vulnerability to sudden interest rate movement (Refer Note 65.3.2). Following table depicts the sensitivity of projected NII to interest rate changes for 2013 and 2014.
Sensitivity to projected NII
| 2014 | 2013 | |||
|
100 bp Parallel Up Rs. ’000 |
100 bp Parallel Down Rs. ’000 |
100 bp Parallel Up Rs. ’000 |
100 bp Parallel Down Rs. ’000 |
|
| As at December 31st | 494,488 | (495,461) | 936,178 | (875,597) |
| Average for the Year | 751,326 | (753,968) | 821,239 | (805,472) |
| Maximum for the Year | 893,537 | (901,327) | 936,178 | (894,456) |
| Minimum for the Year | 494,488 | (495,461) | 677,595 | (676,712) |
Bank conducts regular stress tests on Interest Rate Risk in Banking Book (IRRBB) encompassing changing positions and new economic variables together with systemic and specific stress scenarios. Change in value of the Fixed Income Securities (FIS) portfolio in Held-for-Trading (HFT) category due to abnormal market movements is measured using both Economic Value of Equity (EVE) and Earnings at Risk (EAR) perspectives. Results of stress test on IRR are analyzed to identify the impact of such scenarios on Bank profitability and capital.
Foreign Exchange (FX) Risk
Foreign Exchange risk is the possible impact on earnings or capital, due to movements in exchange rates arising out of maturity mismatches in foreign currency positions other than the base currency, Sri Lankan Rupee (LKR). The Bank has set stringent risk tolerance limits for individual currency exposures as well as aggregate exposures within the regulatory limits to ensure that potential losses arising out of fluctuations in FX rates are minimized and maintained within the Bank’s risk appetite.
USD/LKR exchange rate fluctuated between a low of Rs.130.17 and a high of Rs.131.30 (source: Bloomberg) during the period under review and the annual Rupee depreciation was recorded at approximately 0.90%. Although the movement in the exchange rate was marginal in 2014, the Bank continued to monitor the sensitivity of the Net Open Position (NOP) to changes in USD/LKR exchange rates by applying appropriate exchange rate shocks (Refer Note 65.3.3).
In addition, stress testing is conducted on NOP by applying rate shocks ranging from 6% to 15% in order to estimate the impact on profitability and capital adequacy of the Bank (Refer Note 65.3.3).
EQUITY RISK
Equity and Debt price risks result from being exposed to changes in prices and volatilities of individual equities. Although the Bank’s exposure to this risk is negligible, mark-to-market calculations are conducted either daily or quarterly on held-for-trading and available-for sale portfolios respectively, to identify the impact due to changes in equity prices. The Bank has also commenced VaR calculations on equity portfolio.
COMMODITY RISK
Commodity price risks result from exposures to changes in prices and volatilities of individual commodities. However, the Bank does not have any exposure in commodity risk.
LIQUIDITY RISK
Liquidity risk is the Bank’s inability to meet ‘On’ or ‘Off’ Balance Sheet contractual and contingent financial obligations as they fall due, without incurring unacceptable losses. Banks in general are vulnerable to liquidity and solvency problems resulting from asset and liability mismatches. Therefore, the principle objective in liquidity risk management is to assess the need for funds to meet obligations and to ensure the availability of adequate funding to fulfill those needs at the appropriate time, both under normal and stressed conditions.
In this regard, the Bank continuously analyses and monitors its liquidity profile, maintains an adequate margin of safety in high quality liquid assets and access to diverse funding sources such as inter-bank market, wholesale and retail repurchase agreements, assets and investments available-for-sale and has contingency funding agreements with peer banks to meet liquidity requirements. The Bank thereby ensures availability of adequate liquidity to fund its existing asset base and grow its business whilst maintaining sufficient liquidity buffers to operate smoothly under varying market conditions including any short-term, medium or long-term market disruptions.
ALCO, being the main stakeholder meets at least fortnightly and plays an important role in the Bank’s liquidity management function. ALCO’s main responsibilities include establishing and monitoring liquidity targets together with strategies and tactics to meet those targets, ensuring availability of sufficient liquidity for unanticipated contingencies by focusing on effective diversification in sources and tenors of funding, monitoring Off-Balance Sheet activity related liquidity impact and diversifying deposit maturity base avoiding concentration of resources.
Exposures against tolerance limits and liquidity ratios are regularly monitored by ALCO to take informed decisions with regard to the Bank’s liquidity position and potential funding requirements.
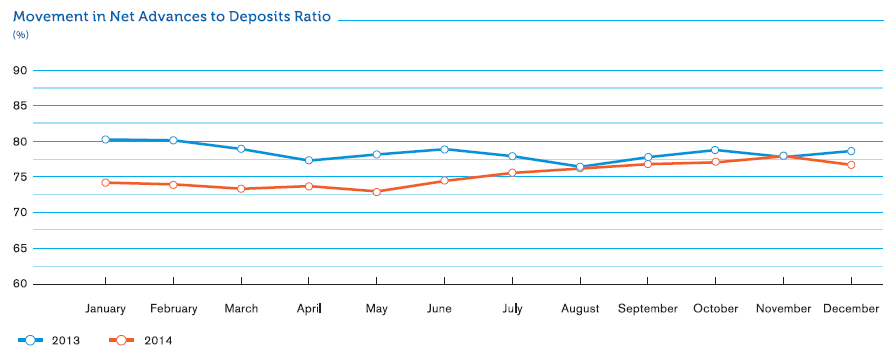
In monitoring its liquidity profile, the Bank uses numerous methods within both stock (based on key ratios) and flow (based on cash inflows and outflows in time bands) approaches. The range of key liquidity risk indicators used by the Bank to assess adequacy of its liquidity position includes, Statutory Liquid Asset Ratio (SLAR), Net Advances to Deposit Ratio, Dynamic and Static (Structural) Liquidity Gap Summary, Core Funding Ratio, Funding Concentration and Commitments Vs Funding Sources. Furthermore, the Bank has in place a more stringent internal limit for maintaining SLAR as compared to the statutory requirement of 20% of total liabilities excluding contingent liabilities.
Net Advances to Deposits Ratio is regularly monitored by ALCO to ensure that the asset and liability portfolios of the Bank are geared to maintain a healthy liquidity position. The following graph depicts the movement in Net Advances to Deposits Ratio during the years 2013 and 2014.
Movement in Net Advances to Deposits Ratio
Maturity Gap Analysis as at December 31, 2014 [Sri Lanka and Bangladesh Operations]
| As at December 31, 2014 |
Up to 1 Month Rs. Mn. |
1-3 Months Rs. Mn. |
3-6 Months Rs. Mn. |
6-12 Months Rs. Mn. |
1-3 Years Rs. Mn. |
3-5 Years Rs. Mn. |
Over 5 Years Rs. Mn. |
Total Rs. Mn. |
| Cash on Hand | 13,266 | – | – | – | – | – | – | 13,266 |
| Deposits with Central Banks | 1,990 | 2,573 | 2,015 | 2,309 | 2,098 | 1,801 | 6,848 | 19,634 |
| Balances due from Head Office, Affiliates and own branches | – | – | – | – | – | – | – | – |
| Balances due from other banks | 21,123 | 198 | 1,057 | – | – | – | – | 22,378 |
| Investments | 12,453 | 13,804 | 32,771 | 25,605 | 53,210 | 77,701 | 52,741 | 268,285 |
| Bills of Exchange | 7,342 | – | – | – | – | – | – | 7,342 |
| Overdrafts | 4,940 | 4,940 | 4,940 | 9,880 | 13,667 | 13,667 | 13,832 | 65,866 |
| Loans and Advances | 32,907 | 47,394 | 37,464 | 39,014 | 93,391 | 50,366 | 30,745 | 331,281 |
| NPLs | – | – | – | 348 | – | – | 1,043 | 1,391 |
| Net Inter-Branch Transactions | – | – | – | – | – | – | – | – |
| Other Assets | 9,529 | 24 | 34 | 59 | 186 | 674 | 10,674 | 21,180 |
| Lines of Credit committed from institutions | 1,000 | – | – | – | – | – | – | 1,000 |
| Others (Reverse Repos) | 32,502 | 7,521 | 1,175 | – | – | – | – | 41,198 |
| Total | 137,052 | 76,454 | 79,456 | 77,215 | 162,552 | 144,209 | 115,883 | 792,821 |
| Demand Deposits | 9,792 | 9,792 | 7,344 | 9,792 | – | – | 12,240 | 48,960 |
| Savings Deposits | 9,930 | 9,930 | 9,930 | 19,861 | 49,652 | 49,652 | 49,652 | 198,607 |
| Balances due to Head Office, Affiliates and own branches | – | – | – | – | – | – | – | – |
| Balances due to other banks | 18,071 | 89 | 3,304 | 1,322 | – | – | – | 22,786 |
| Time Deposits | 33,230 | 47,799 | 35,268 | 32,333 | 7,918 | 4,383 | 112,190 | 273,121 |
| Certificate of Deposits, Borrowings and Bonds | 353 | 533 | 1,212 | 1,540 | 6,259 | 2,297 | 10,988 | 23,182 |
| Net Inter-Branch Transactions | – | – | – | – | – | – | – | – |
| Bills payable | – | – | – | – | – | – | – | – |
| Interest payable | 9,607 | 1,705 | 1,507 | 1,652 | 1,297 | 314 | 25 | 16,107 |
| Provisions other than NPLs and Depreciation of Investments | – | – | – | – | – | – | – | – |
| Other Liabilities | 8,012 | 1,362 | 1,702 | – | 110 | 1,944 | 482 | 13,612 |
| Lines of Credit committed to institutions | 1,000 | – | – | – | – | – | – | 1,000 |
| Unutilised portion of Overdrafts and Advances | 22,211 | 3,857 | 3,857 | 7,714 | 10,671 | 10,671 | 13,387 | 72,368 |
| Letters of Credit/Guarantees/ Acceptance | 24,134 | 26,737 | 16,809 | 13,107 | 6,493 | 1,953 | 2 | 89,235 |
| Repos/Bills Rediscounted/SWAPs/ Forward contracts | 113,702 | 52,381 | 44,358 | 44,179 | 2,068 | – | – | 256,688 |
| Others | – | – | – | – | – | – | 68,522 | 68,522 |
| Total | 250,042 | 154,185 | 125,291 | 131,500 | 84,468 | 71,214 | 267,488 | 1,084,188 |
| Period Gap | (112,990) | (77,731) | (45,835) | (54,285) | 78,084 | 72,995 | (151,605) | – |
| Cumulative Gap | (112,990) | (190,721) | (236,556) | (290,841) | (212,757) | (139,762) | (291,367) | – |
| Cumulative Liabilities | 250,042 | 404,227 | 529,518 | 661,018 | 745,486 | 816,700 | 1,084,188 | – |
| Cumulative Gap as a percentage (%) of Cumulative Liabilities | (45) | (47) | (45) | (44) | (29) | (17) | (27) | – |
Maturity analysis of financial assets and financial liabilities of the Bank does not indicate any adverse situation giving due cognizance to the fact that cash out flows in the overnight tenor include savings deposits which can be considered as a quasi stable source of funds based on historical behavioural patterns of such depositors.
Core Funding Ratio, an indicator of the stability of funding sources compared to loans and advances granted was maintained well above the policy threshold of 90%, which is considered healthy to support the Bank’s business model and growth.
In addition to above the mentioned measures in monitoring its liquidity position, the Bank also monitors regulatory liquidity ratios on a quarterly basis (Refer Note 65.2).
Funding concentration for both LKR and FCY is measured against the appropriate deposit base to ascertain whether potential risks are within the threshold limits. Potential liquidity commitments resulting from loan disbursements and undrawn overdrafts were well below available funding sources during the year under review. This indicates a very remote possibility of potential liquidity risk from undrawn commitments as the Bank generally does not have any credit limits having irrevocable commitments.
The Bank conducts regular liquidity stress tests and scenario analysis to evaluate the potential impact of sudden and severe stress events on the Bank’s liquidity position. This enables the Bank to proactively identify appropriate funding arrangements that can be used to manage such stress situations with a minimum financial and/or reputational impact.
The Contingency Funding Plan of the Bank provides guidance in managing liquidity crisis. It outlines various ways in which the Bank monitors assets and liabilities of the Bank, while emphasising ways to avoid any major crisis in liquidity. It also details out the procedure to address unlikely but possible events of either short or long-term funding crisis, forecast funding needs as well as funding sources under different market situations including aggressive asset growth or loan rollover, rapid liability erosion or sharp decline in deposits during a 3-month time period, which is considered the most critical time span in a liquidity crisis. Management and reporting framework with early warning signals and means to avoid and mitigate possible crisis promptly, Management Action Plan with alternative sources of inflows and trigger levels for action, communication plan to prevent further escalation or contagion and regular sources of liquidity supplemented with contingent sources in detail are among other things covered under this document.
Value-at-Risk Measurements (VaR)
The Bank carries out VaR calculations on four portfolios categorised as Held-for-Trading (HFT), using a market risk software solution. This solution has the capability of computing VaR in three methodologies namely, Historical Simulation, Monte Carlo Simulation and Variance-Covariance in order to measure its market risk exposure in an efficient manner and to meet regulatory compliance. The Bank computes VaR in line with Basel II Market Risk framework, considering a 99% ‘Confidence Interval’ and a 10-trading-days Holding Period. VaR, a quantitative measure depicts the maximum loss the Bank shall incur, under specific conditions during a given period due to changes in interest rates, exchange rates, debt and equity prices as well as price of financial products.
OPERATIONAL RISK
1. Overview
The Bank, in its normal conduct of business activities is exposed to Operational Risk, which is inherent in all banking products and processes. Operational Risk is defined as the risk of losses stemming from inadequate or failed internal processes, people and systems, or from external events such as natural disasters, social or political events. Operational Risk includes Legal Risk but excludes Strategic and Reputational Risk.
Failure to manage Operational Risk effectively often results in significant financial losses, as well as reputational damage which could aggravate such adverse impact leading to brand erosion and could give rise to regulatory penalties, all of which directly impact shareholder value.
By its nature, Operational Risk cannot be totally eliminated. However, the Bank has established a robust methodology in managing Operational Risk in the form of an ‘Operational Risk Management Framework’ which defines the Bank’s approach in identifying, assessing, mitigating, monitoring and reporting the Operational Risks which may impact the achievement of the Bank’s business objectives.
The Bank manages its Operational Risk based on an organization-wide consistent framework that enables determination of its Operational Risk profile in comparison to its risk appetite and systematically identifies Operational Risk themes and concentrations to define risk mitigating measures and priorities.
The Operational Risk Management Framework approved by the Board of Directors is implemented by an independent Operational Risk Management Unit under the supervision of Executive Integrated Risk Management Committee (EIRMC), in co-ordination with other essential elements of the Bank’s control framework such as Internal Audit, Information Security and Business Continuity.
During the year under review the Bank continued to enhance its Operational Risk Management Framework including organisational structures, risk identification process and systems in support of effective mitigation and control of Operational Risk.
2. Management Process
Operational Risk Management in the Bank is governed by the well-defined Operational Risk Management Policy that is clearly communicated across the Bank. The Risk Management responsibilities and obligations of the Board of Directors, Corporate Management, Operational Risk Management Unit (ORMU) and all other Risk Owners are clearly specified in the policy which is reviewed annually.
3. Identification and Assessment of Operational Risk
Risk and Control Self-Assessment (RCSA) is a key component of the Bank’s Operational Risk Management Framework. It involves each business function within the Bank proactively identifying and assessing its significant Operational Risks and the controls in place to manage those risks, on a half-yearly basis. The findings from the RCSA exercise is used to formulate appropriate action plans to address identified control gaps which are monitored as part of the overall Operational Risk Management exercise. The Bank is in the process of enhancing this exercise with the assistance of the newly implemented Operational Risk Management System, where the identified risks and the mitigating actions can be effectively tracked.
The Operational Risk Management Unit (ORMU) also reviews and ensures that risks associated with the introduction of new products, processes, systems and services are identified, analysed and addressed prior to launch and/or implementation.
4. Mitigation of Operational Risk
The Bank operates within a robust system of internal controls that seeks to ensure business is transacted and risks assumed without exposure to unacceptable potential losses or reputational damage.
Once Operational Risks are identified, mitigation is planned following the 'as low as reasonably practicable (ALARP)' principle by balancing the cost of mitigation with the benefits thereof and formally accepting the Residual Risk. Several risk mitigation policies and programmes are in place to maintain a sound operating environment within the established risk appetite of the Bank.
Insurance coverage is used as an external mitigant for ‘low probability – high impact’ events and uncontrollable Operational Risk events such as damage to physical assets by natural disasters, fire etc. Accordingly, the Bank has transferred insurable risks by obtaining insurance policies from reputed insurance providers, which are periodically reviewed comprehensively by the ORMU for adequacy.
The policy and procedures relating to outsourcing of business activities of the Bank ensures that all significant risks arising from outsourcing arrangements of the Bank are identified and effectively managed on a continuous basis. Details of all outsourced functions are reported to Central Bank of Sri Lanka annually. Due diligence tests of outsourced vendors are carried out by respective risk owners prior to entering into new agreements and renewal of existing agreements. Assistance of Information Systems (IS) Audit Unit is obtained when conducting due diligence tests of outsourced parties who provide IT services.
Technology Risk is managed in a systematic and consistent manner to avoid potential operational losses to the Bank resulting from technological obsolescence. Accordingly, existing Information Technology systems including the core-banking system are upgraded and new software solutions are implemented in a timely and appropriate manner.
The Bank has a comprehensive Business Continuity Plan (BCP) and Disaster Recovery Plan (DRP) to assure the immediate continuity of all essential operations in case of a disaster and the eventual continuity of all other operations. This plan is continuously updated and tested to ensure ongoing readiness. Further, BCP and DRP are subject to annual independent reviews of ORMU and Internal Audit.
Continuous emphasis through training programmes and creating risk awareness across the Bank, together with high standards of ethics and integrity also boost Bank’s risk mitigatory measures.
5. Monitoring and Reporting of Operational Risk
Monitoring and reporting under the Bank’s Operational Risk Management Framework centers around the functions relating to monitoring of Key Operational Risk Indicators (KORIs) against the corresponding tolerance levels and reporting same to designated committees as appropriate. Further, the key functions of Operational Risk Management includes monitoring and reporting of compliance with mandatory banking and other statutory requirements, abnormal transactions including Anti-Money Laundering and Terrorist Financing activities, and internal and external reporting of Operational Risk events.
KORIs are statistical data collected and monitored by the ORMU on an ongoing basis to enable early detection of potential risks and possible operational control weaknesses. The indicators are related to both financial and non-financial events. A database of Operational Risk events and losses, including losses without any financial impact and 'near misses' has been established to facilitate the analysis of loss trends and root causes.
The Bank has collected loss data and has recorded the same according to the different risk event types under each business line as prescribed in the Basel II. Bank has successfully collected loss data over a period which is one of the major components in moving towards advanced approaches in Operational Risk capital calculations in future.
The Bank has a low appetite for Operational Risks for which it is exposed to. Accordingly, the Bank has established tolerance levels for all material Operational Risk loss types by considering several factors which include historical loss data, budgets and forecasts, performance of the Bank, existing systems and controls governing Bank operations etc.
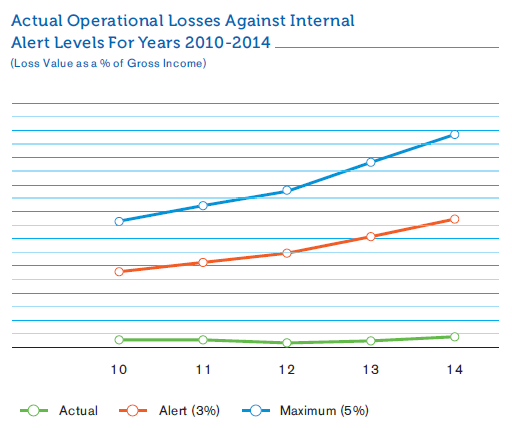
The Bank has established following thresholds for monitoring purposes, considering audited financials:
- Alert Level - 03% of the average gross income for the last three years.
- Maximum Level - 05% of the average gross income for the last three years.
In addition to the above, thresholds for selected non-financial Operational Risk Indicators such as staff turnover, system failures etc. are also in force.
ORMU of the Bank closely monitors and reports the actual operational losses against the above tolerance levels on a monthly basis to the EIRMC and BIRMC. The unit initiates necessary actions to review the existing controls relating to all unusual operational loss events including ‘near misses’ and events with possible losses even though they are within alert levels, and proposes additional controls if the existing controls are deemed to be inadequate.
Analysis of Operational Risk Loss Events
As illustrated in the following graph, actual operational losses for the current year (2014) is mere 0.24% (of average audited gross income for last three years), which is well within the internal Alert Level of 03%. Further, Bank’s consistency in maintaining losses at minimal levels over the period of the last five years is evident from the graph.
Actual Operational Losses Against Internal Alert Levels For Years 2010-2014
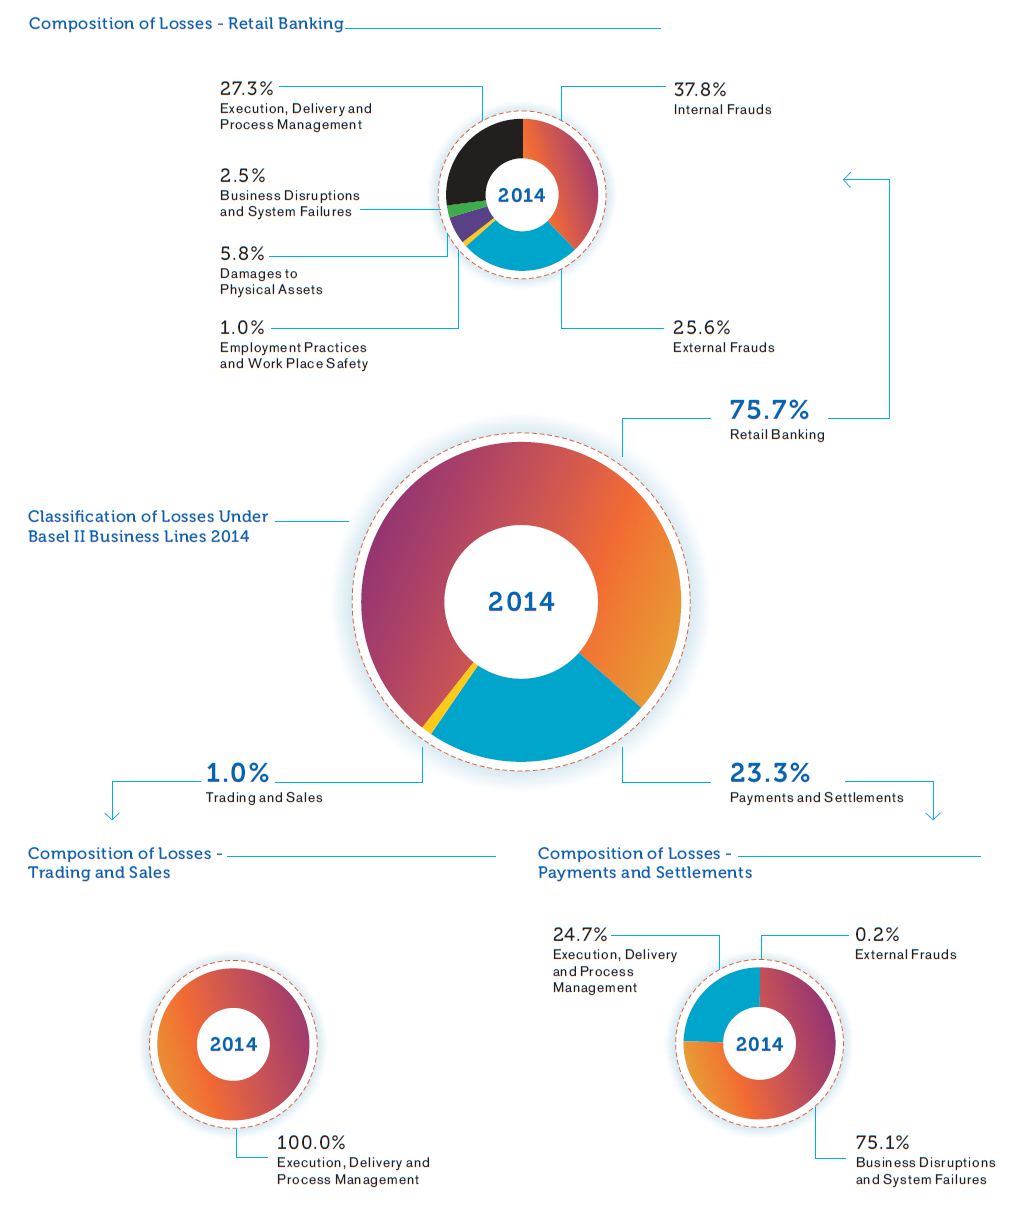
Following charts drill-down on the Operational Risk losses incurred by the Bank under each business line/category during the year 2014.
Composition of Losses - Retail Banking
When analysing the losses incurred during 2014 under the Basel II defined business lines, it is evident that the composition remains consistent with the previous years where the majority (76%) of losses with financial impact falls under the ‘Retail Banking’ business line, followed by the losses reported under the business line of ‘Payment and Settlements’. Losses relating to other business lines remain negligible.
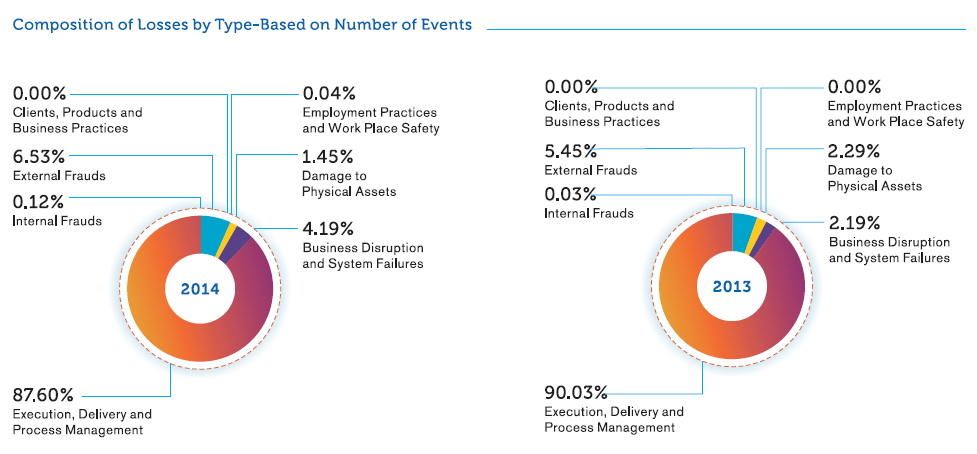
The following graphs depict the comparison of operational losses reported during the last two years under each Basel II loss event type both in terms of number of occurrences and value.
Majority of the losses encountered by the Bank during 2014 consists of ‘high frequency-low financial impact’ events mainly falling under the loss type ‘Execution, Delivery and Process Management’. These low value events are mainly related to cash and ATM operations of the Bank’s service delivery network consisting of over 880 points across Sri Lanka and Bangladesh. Individual events with monetary values less than Rs. 100,000/- account for more than 97% of the total loss events for the year. Also, the average number of loss events for the year stands at a mere 0.001% when compared to the average number of transactions performed during the year, which is a further improvement compared to the last year’s statistics.
Composition of Losses by Type-Based on Number of Events
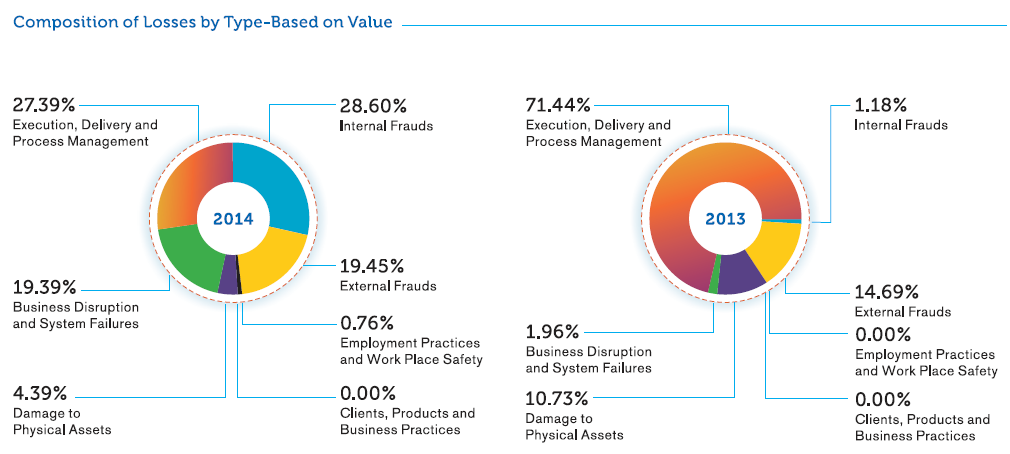
Composition of Losses by Type-Based on Value
When considering the values of the losses incurred by the Bank during the period under review, they can be mainly categorised under internal and external frauds, execution, delivery and process management-related, and business disruptions and system failures. Nevertheless, as described earlier, total of the actual operational risk-related losses for 2014 remains at a mere 0.24% of the average audited gross income for last three years, as compared to the capital allocation of 15% under the ‘Basic Indicator Approach’ (BIA) of capital computation as per Basel II. This trend of exceptionally low levels of Operational Risk losses of the Bank bears testimony to the effectiveness of the Bank’s Operational Risk Management Framework and the internal control environment.
Stress Testing of Operational Risk
The Bank commenced conducting of Stress Testing on operational losses during the year 2014 by considering the historical data as per the scenarios proposed in the Stress Testing Policy of the Bank. This exercise is being carried out quarterly by the Bank as an additional measure to confirm its sound position.
IT Risk
Information Technology (IT) Risk is defined as the business risk associated with the use, ownership, operation, involvement, influence and adoption of IT within an organisation. IT systems have become critical to every aspect of the Bank’s business and operations, resulting in IT Risk to become a major component of Operational Risk. IT Risk consists of IT-related events such as system interruptions, errors, frauds through system manipulations, obsolescence in applications, falling behind competitors concerning the technology, etc. that could potentially impact the business as a whole. It can occur with both uncertain frequency and magnitude, and it creates challenges in meeting strategic goals and objectives of the organisation.
In this context, the Bank has implemented an Information Technology Risk Management Framework whereby all significant IT risks are managed in a consistent and effective manner across the organisation. As part of this initiative, the Bank has introduced a dedicated, independent IT Risk Function under the ORMU in 2012, which will ultimately enhance the controls relating to IT Risk.
Under the framework, an IT Risk Management Policy which complements the Information Security Policy, the related processes, objectives and procedures relevant for managing risk and improving information security of the Bank has been implemented.
The IT Risk Management process of the Bank follows the same established structure of the Operational Risk Management process. Accordingly, RCSA is used as the core mechanism for IT Risk identification and assessment, while the IT Risk Unit carries out independent IT Risk reviews both separately and in conjunction with regular Operational Risk reviews. Results of these independent IT Risk assessments together with audit findings, analysis of information security incidents, internal and external loss data are also employed for IT Risk identification and assessment purposes.
IT Risk mitigation involves prioritising, evaluating and implementing the appropriate risk-reducing controls or risk treatment techniques recommended from the risk identification and assessment process. The Bank has implemented a range of controls including technical, operational and management controls required to mitigate its identified IT Risks and potential vulnerabilities, strengthened by the Bank’s implementation of an Information Security Management System (ISMS) established as per ISO 27001:2013 Information Security Standard.
The Bank has defined a list of Key IT Risk Indicators (KIRIs) along with corresponding thresholds that are set according to what level is deemed ‘Tolerable’, ‘Alert’ and ‘Unacceptable’. The IT Risk Unit carries out continuous monitoring of the KIRIs, which involves comparing estimated risks with established criteria where risks that are outside set thresholds receive a differential level of management attention in order to initiate corrective action as necessary.
Legal Risk
Legal Risk, an integral part of Operational Risk, arises out of the legal implications of failed systems, people, processes or external events. Legal Risk includes, but is not limited to, exposure to fines, penalties, or punitive damages resulting from supervisory actions, as well as private settlements.
Legal Risk is managed by ensuring that applicable regulations are fully taken into consideration in all relations and contracts with individuals and institutions who maintain business relationships with the Bank, and that they are supported by required documentation whereas risk of breaching the rules and regulations are managed by establishing and operating a sufficient mechanism for verification of conformity of operations with applicable regulations.
Compliance and Regulatory Risk
Regulatory Compliance Risk refers to the potential risk of incurring regulatory sanctions, financial and/or reputational damage arising from failure to comply with applicable laws, rules and regulations and codes of conduct applicable to banking activities. This risk is identified, monitored and managed by the Bank through a structured framework of policies and procedures. The Compliance Function is in place to assess the Bank’s compliance with external and internal regulations and a comprehensive Compliance Policy has been implemented to strengthen the Compliance Function.
Other Related Risks
Strategic Risk
Strategic Risks are those that either affect or are created by strategic decisions. They could materialise due to internal or external factors that can cause reduction in shareholder value, loss of earnings, etc.
In the Bank, Strategic Risk is managed by critically reviewing the strategic goals in the Bank’s well defined Corporate Planning and Budgeting process and aligning those with the Vision and Mission statements to set a clear strategic direction. The detailed Scorecard based qualitative model aligned to ICAAP is used to measure and monitor Strategic Risk of the Bank. This Scorecard based approach takes into consideration a range of factors, including the size and sophistication of the organisation, the nature and complexity of its activities in measuring Strategic Risk and highlights the areas that need emphasis to mitigate potential Strategic Risks.
Expansive
With a highly successful and sustainable business model in place, Commercial Bank made a judicious and strategic foray beyond our shores.
Today, the Bank is present in Bangladesh and many other countries through Business Promotion Officers, proving the effectiveness and suitability of our core banking prospects in countries beyond our home.
As of today, Bangladesh operation contributes 13% to the Bank‘s bottom-line.
Reputational Risk
Reputational Risk is the risk of adverse impact on earnings or organisational value arising from negative stakeholder perception of the Bank’s business practices, activities and financial condition. The Bank recognises that Reputational Risk is driven by a wide range of other business risks that must all be actively managed.
Accordingly, Reputational Risk is broadly managed through the systems and controls adopted for all other risk types such as Credit, Market, Operational Risk etc. Further, Reputational Risk is measured through the detailed Scorecard-based model developed by the Bank to measure and monitor Reputational Risk under ICAAP. Timely actions are initiated to mitigate potential Reputational Risks by critically evaluating the criteria given in the said Scorecard.
Basel II Pillar 2 and Internal Capital Adequacy Assessment Process (ICAAP)
The Bank implemented an ICAAP Framework which introduced a process for assessing total overall capital adequacy in relation to its risk profile.
The primary objective of ICAAP is supporting the regulatory review process through valuable inputs for evaluating the required capital in line with future business plans. It integrates strategic plans and risk management plans with the capital plan in a meaningful manner. It also supports profit optimisation through proactive decisions on exposures both current and potential through measurement of vulnerabilities by carrying out stress testing and scenario-based analysis. Another business benefit for the Bank arising out of ICAAP is the identification of gaps in managing qualitative and quantitative aspects of reputational risk and strategic risk which are not covered under Pillar 1 of Basel II.
Stress Testing
Stress testing refers to various techniques (quantitative and qualitative) used by the Bank to gauge its vulnerability to exceptional but plausible events. It is also considered as an integral part of ICAAP under Pillar 2. Stress testing considers the size of the Bank, sophistication and diversification of its activities, materiality of different risk types and the Bank’s vulnerability to such type of risk factors.
Since it provides a broader view of all risks borne by the Bank in relation to its risk tolerance and strategy in a hypothetical stress situation, stress testing has become an effective communication tool to Senior Management, Risk Owners and Risk Managers as well as Supervisors and Regulators.
In deciding the scenarios for stress testing, the Bank has taken into consideration a number of factors such as historical data, the current portfolio mix, desired portfolios etc. Stress testing framework has also focused on forward looking hypothetical scenarios that cover issues and risks which may not be identified by evaluating past and present data alone.
The stress testing framework covers all the material risks such as Credit Risk, Credit Concentration Risk, Operational Risk, Liquidity Risk, Foreign Exchange Risk, Interest Rate Risk in the Banking Book using Economic Value of Equity (EVE) and Earnings at Risk (EAR) perspectives.
The results of the stress testing are reported to the EIRMC and BIRMC on a quarterly basis for appropriate, proactive decision-making.