Investor Relations Supplement
Dear Investor,
As you are aware this ‘Investor Relations Supplement’ is presented to you in recognition of your continual support to the success of the Bank. We consider this as an important part of our corporate responsibility to have an effective dialogue with investors. Furthermore, it enables us to provide timely, transparent, accurate and consistent information to the investing public as part of our shareholder engagement process.
Through shareholder engagement, we expect you to actively seek to influence the behaviour of your Bank within your investment portfolio to improve the performance of areas such as environmental, social and governance. Another goal of this engagement is to create a productive dialog to address the risks related to above factors and thereby improve Long Term corporate performance.
The full Annual Report together with audited accounts and the interim Financial Statements are available on the Bank’s website (http://www.combank.lk/newweb/investor-relations). Alternatively, shareholders are able to elect to receive a mailed copy of the Annual Report on request. The Company Secretary of the Bank responds to individual letters received from shareholders.
Our Stock
The shares of the Commercial Bank of Ceylon are listed on the Main Board of the Colombo Stock Exchange (CSE), under the ticker symbol ‘COMB’. Details of trading activity and daily share prices are published in most daily newspapers, including the Daily FT, Daily News, The Island and Daily Mirror generally under the abbreviation of Commercial Bank or COMB.
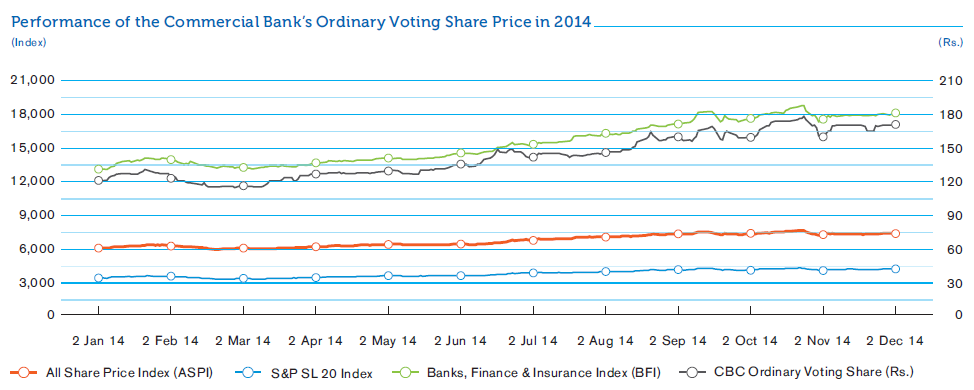
Performance of the Commercial Bank s Ordinary Voting Share Price in 2014
Major Achievements in 2014
Commercial Bank in World’s Top 1000 Banks for 4th successive year

The Commercial Bank of Ceylon has been ranked among the Top 1000 Banks of the World for a fourth successive year in 2014, becoming the only Sri Lankan bank to achieve this feat. This prestigious ranking published annually by ‘The Banker’ magazine of the UK, is an important endorsement of the consistent growth and key performance indicators achieved by Sri Lanka’s largest private bank. The Top 1000 World Banks ranking is compiled from a database of over 5,000 of the world’s biggest banks and is acknowledged by the global financial community as the definitive guide to bank rankings and analysis.
Making the Top 1000 list is a noteworthy achievement by itself, but staying there for four years in a row despite the challenging conditions we operate in, reflects well on the strength and stability of the Bank. A noteworthy feature of the 2014 ranking is the rise to the number one position of Industrial Commercial Bank of China (ICBC), displacing last year’s top ranked banks, Bank of America and JPMorgan Chase & Co., which have now taken third and second places respectively, and are followed by HSBC in fourth place.
‘Best Bank In Sri Lanka’ title for the 15th consecutive year

The Commercial Bank of Ceylon has been rated the Best Bank in Sri Lanka by Global Finance, one of the world’s leading publications serving the international business community. This benchmark ranking published annually by Global Finance for 21 years, names Commercial Bank among the best emerging markets banks in 30 countries in the Asia Pacific region in 2014, reaffirming the Bank’s consistent country-leading performance.
Criteria for choosing the winners included growth in assets, profitability, strategic relationships, customer service, competitive pricing, and innovative products. In addition, for the first time, a poll of Global Finance’s corporate readership was conducted in order to increase the accuracy and reliability of the results.
Ranked alongside Commercial Bank as the best banks in 2014 in their respective countries are China Merchants Bank (China), HDFC Bank (India), Shinhan Financial Group (South Korea), Public Bank (Malaysia), Standard Chartered Bank (Nepal), Siam Commercial Bank (Thailand) and Bank Central Asia (Indonesia).
Commercial Bank ranked ‘The Strongest Bank in Sri Lanka in 2014‘

The Commercial Bank of Ceylon has added another prestigious international accolade to its collection, being adjudged ‘The Strongest Bank in Sri Lanka in 2014’ by The Asian Banker, a leading provider of strategic intelligence on the financial services industry. The award is based on a detailed and transparent scorecard that ranks commercial banks on six areas of Balance Sheet financial performance: the ability to scale, Balance Sheet growth, risk profile, profitability, asset quality and liquidity.
This ranking as Sri Lanka’s strongest bank places Commercial Bank among The Asian Banker ‘500 Largest and Strongest Banks’ - a ranking widely followed by investors, analysts and the media as the leading source to assess the financial strength of commercial banks in the region.
Ranked alongside Commercial Bank in The Asian Banker 500 as the strongest banks in their respective countries are Westpac Banking Corporation (Australia), Janata Bank (Bangladesh), China Construction Bank Corporation (China), HDFC Bank (India), Sumitomo Mitsui Financial Group (Japan), Maybank (Malaysia), ANZ Bank New Zealand (New Zealand), MCB Bank (Pakistan), DBS Group (Singapore), Shinhan Financial Group (South Korea), Cathay United Bank (Taiwan) Siam Commercial Bank (Thailand) and Standard Bank Group (South Africa).
‘Sri Lanka’s Bank of the Year in 2014 ‘ by The Banker Magazine

As its financial year draws to a close, the Commercial Bank of Ceylon has achieved yet another milestone, being declared Sri Lanka’s ‘Bank of the Year’ by the respected UK-based ‘The Banker’ Magazine. This is the ninth Bank of the Year award presented to Commercial Bank by ‘The Banker’ – the magazine that is also responsible for the annual ranking of the Top 1,000 Banks of the World. The Bank of the Year Award also referred to as ‘Bracken’ is considered the ‘Oscar’ of the international banking industry, and is decided on performance across diverse key indicators.
Performance in key areas covers qualitative achievements, strategic initiatives, financial results, growth rates and performance data as well as other aspects such as technology and key strategic developments. Other Bank of the Year Award winners ranked alongside Commercial Bank in 2014 included those of the calibre of Westpac, Royal Bank of Canada, Raiffeisen Bank and Axis Bank.
Commercial Bank’s Annual Report Best among private banks in South Asia

The 2013 Annual Report of the Commercial Bank of Ceylon PLC has won two key awards at the Best Presented Annual Report Awards presented by the South Asian Federation of Accountants (SAFA), reaffirming the high quality of the Bank’s financial reporting standards.
The Bank was also adjudged the winner in the ‘Private Sector Banks’ category and was the first runner-up for the SAARC Anniversary Award for Corporate Governance Disclosures, at this prestigious event. The SAFA Awards, presented annually under different categories, are conferred on the basis of evaluations administered by the Federation’s Committee for Improvement in Transparency, Accountability and Governance, of the published Annual Reports of entries from South Asian countries.
In second and third place among private sector banks in the South Asian region were MCB Bank Limited of Pakistan and Prime Bank Limited of Bangladesh.
Commercial Bank wins ‘Top 10’ Award at the 2014 Best Corporate Citizen Awards

The Commercial Bank’s status as one of Sri Lanka’s leading corporate citizens was emphatically reaffirmed by the Ceylon Chamber of Commerce presented the country’s largest private bank with the Runner-Up award at the 2014 Best Corporate Citizen Sustainability Awards, along with seven more accolades.
While retaining its position as one of the Top 10 Best Corporate Citizens in Sri Lanka, the Bank emerged the winner in the category award for ‘Economic Contribution,’ took the award for ‘Economic Sustainability’ in the Triple Bottom Line category and was awarded as the winner in ‘Financial Services’ in the sector awards. Under the project category the Bank was recognised with a special Long Term Project Award for its efforts to support the national healthcare system. This was the only award that was presented in this category and was a special honour for the Bank’s consistent and ongoing efforts to support the national healthcare system. Commercial Bank also received a Merit Award for its coral replanting project in Hikkaduwa.
The Long Term Project Award presented to Commercial Bank at the Best Corporate Citizen awards is in respect of the Bank’s on-going programme of donations of critical care equipment and other facilities to Government hospitals around the country, alongside support to refurbish buildings where necessary
Commercial Bank rated Most Respected Bank in Sri Lanka

The Commercial Bank of Ceylon has been rated as the most respected bank in Sri Lanka for the 10th consecutive year and the second ‘Most Respected’ corporate entity in the country for the fourth consecutive year in the annual LMD rankings. Additionally, the Bank was ranked No. 1 in Sri Lanka for ‘Honesty’ for the second successive year, topping the category that is most important to businesses in the financial services sector.
Commercial Bank is the only bank among the Top 5 Most Respected entities in Sri Lanka, and is ranked among the Top 3 in several other key aspects such as Financial Performance, Quality Consciousness, Management Profile, CSR and Vision. The Bank has been the Most Respected Bank in the list since its inception in 2005.
The 2014 and tenth edition of this prestigious list of Sri Lanka’s most respected companies includes the most diversified conglomerates in the country and some of the world’s best-known multinationals.
Commercial Bank Sweeps the Board at Brand Excellence 2014

The Commercial Bank of Ceylon won the coveted ‘Service Brand of the Year’ and three other accolades at the 2014 SLIM Brand Excellence Awards to become the bank that won the most awards at this prestigious event conducted by the Sri Lanka Institute of Marketing.
Sri Lanka’s largest private bank took the Golds in the ‘Service Brand’ category and in the ‘Best New Entrant’ category for its ‘Anagi’ Savings Account for Women, as well as the Silver in the ‘Best Local Brand’ and the Bronze in the ‘CSR Brand of the Year’ categories in a dominant showing at this annual gala.
Held for the 13th successive year, SLIM Brand Excellence Awards honour the brand building efforts of organisations. It is a keenly contested event and this year the entries reached an all time high of over 100 applications from more than 40 industries.
A summary of ‘Awards and Accolades’ won by the Bank during the recent past is given in the Supplementary Information section.
Compliance Report on the Contents of Annual Report in Terms of the Listing Rules of the CSE
This year too, we are pleased to inform you that your Bank has complied with all the requirements of the Section 7.6 of the Listing Rules of the CSE on the contents of the Annual Report and Accounts of a Listed Entity.
The table below provides reference to the relevant sections of this Annual Report where specified information is found together with page references for the convenience of the readers:
| Rule No. | Disclosure Requirement | Section/Reference |
| 7.6 (i) | Names of persons who held the position of Directors during the financial year |
|
| 7.6 (ii) | Principal activities of the Bank and its Subsidiaries during the year and any changes therein |
|
| 7.6 (iii) | The names and the number of shares held by the 20 largest holders of voting and non-voting shares and the percentage of such shares held as at the end of the year |
|
| 7.6 (iv) | The public holding percentage |
|
| 7.6 (v) | Directors’ and Chief Executive Officer’s holding in shares at the beginning and at the end of the financial year |
|
| 7.6 (vi) | Information pertaining to material foreseeable risk factors |
|
| 7.6 (vii) | Details of material issues pertaining to employees and industrial relations |
|
| 7.6 (viii) | Extents, locations, valuations and the number of buildings of the land holdings and investment properties |
|
| 7.6 (ix) | Number of shares representing the stated capital |
|
| 7.6 (x) | A distribution schedule of the number of holders in each class of equity securities, and the percentage of their total holdings |
|
| 7.6 (xi) | Ratios and market price information: | |
|
|
|
|
|
|
|
|
|
| 7.6 (xii) | Significant changes in the Bank or its Subsidiaries fixed assets and the market value of land, if the value differs substantially from the book value |
|
| 7.6 (xiii) | Details of funds raised through Public Issues, Rights Issues, and Private Placements during the year |
|
| 7.6 (xiv) | Information in respect of Employee Share Option Schemes: | |
|
|
|
|
|
|
| 7.6 (xv) | Disclosures pertaining to Corporate Governance practices in terms of Rules 7.10.3, 7.10.5 (c) and 7.10.6 (c). of Section 7 of the Listing Rules |
|
| 7.6 (xvi) | Disclosures on Related Party Transactions exceeding 10% of the Equity or 5% of the total assets of the Entity as per Audited Financial Statements, whichever is lower |
|
1. Quarterly Performance – 2014 Compared to 2013
Summary of the Income Statements
| 2014 | 2013 | |||||||||
|
1st Quarter Mar. 31 Rs. Mn. |
2nd Quarter Jun. 30 Rs. Mn. |
3rd Quarter Sept. 30 Rs. Mn. |
4th Quarter Dec. 31 Rs. Mn. |
Total Rs. Mn. |
1st Quarter Mar. 31 Rs. Mn. |
2nd Quarter Jun. 30 Rs. Mn. |
3rd Quarter Sept. 30 Rs. Mn. |
4th Quarter Dec. 31 Rs. Mn. |
Total Rs. Mn. |
|
| Group | ||||||||||
| Net Interest Income | 6,575.9 | 6,448.7 | 6,974.0 | 7,321.3 | 27,319.9 | 6,303.3 | 6,365.4 | 6,728.4 | 6,501.8 | 25,898.9 |
| Net Fees and Commission Income | 1,047.7 | 1,148.0 | 1,298.5 | 1,355.2 | 4,849.4 | 909.0 | 1,012.9 | 1,225.2 | 1,105.7 | 4,252.8 |
| Other Operating Income (Net) | 1,295.4 | 1,105.5 | 2,503.9 | 2,086.4 | 6,991.2 | 1,244.1 | 1,096.1 | 1,399.9 | 2,330.2 | 6,070.3 |
| Less: Impairment Charges for Loans and Other Losses | 1,144.8 | 1,197.1 | 1,254.6 | 1,301.9 | 4,898.4 | 1,198.9 | 1,263.4 | 1,293.1 | 1,421.5 | 5,176.9 |
| Net Operating Income | 7,774.2 | 7,505.1 | 9,521.8 | 9,461.1 | 34,262.1 | 7,257.5 | 7,211.0 | 8,060.4 | 8,516.2 | 31,045.1 |
| Less: Expenses | 4,450.4 | 4,294.1 | 4,765.3 | 4,898.8 | 18,408.6 | 4,004.1 | 3,918.9 | 4,161.6 | 4,274.9 | 16,359.4 |
| Operating Profit | 3,323.8 | 3,211.0 | 4,756.5 | 4,562.2 | 15,853.5 | 3,253.4 | 3,292.1 | 3,898.8 | 4,241.4 | 14,685.7 |
| Add: Share of Profits/(Losses) of Associate Companies | 0.9 | 6.2 | 1.0 | (1.6) | 6.5 | 1.8 | 1.1 | 2.0 | 0.3 | 5.3 |
| Profit Before Income Tax | 3,324.7 | 3,217.2 | 4,757.5 | 4,560.6 | 15,860.0 | 3,255.2 | 3,293.2 | 3,900.9 | 4,241.7 | 14,691.0 |
| Less: Income Tax Expense | 1,022.6 | 999.5 | 1,425.9 | 1,169.2 | 4,617.2 | 998.4 | 1,060.0 | 1,144.3 | 914.8 | 4,117.5 |
| Profit for the Period | 2,302.1 | 2,217.8 | 3,331.6 | 3,391.4 | 11,242.8 | 2,256.8 | 2,233.2 | 2,756.6 | 3,326.9 | 10,573.5 |
| Quarterly profit as a % of the profit after tax | 20.5 | 19.7 | 29.6 | 30.2 | 100.0 | 21.3 | 21.1 | 26.1 | 31.5 | 100.0 |
| Cumulative quarterly profit as a % of the profit after tax | 20.5 | 40.2 | 69.8 | 100.0 | 21.3 | 42.5 | 68.5 | 100.0 | ||
| Bank | ||||||||||
| Net Interest Income | 6,571.4 | 6,444.4 | 6,945.9 | 7,260.2 | 27,221.9 | 6,300.7 | 6,362.2 | 6,723.5 | 6,498.6 | 25,885.0 |
| Net Fees and Commission Income | 1,046.6 | 1,146.9 | 1,297.4 | 1,340.4 | 4,831.3 | 908.1 | 1,012.3 | 1,224.2 | 1,104.7 | 4,249.3 |
| Other Operating Income (Net) | 1,277.3 | 1,094.2 | 2,503.6 | 2,142.0 | 7,017.1 | 1,224.4 | 1,101.0 | 1,408.3 | 2,362.3 | 6,096.0 |
| Less: Impairment Charges for Loans and Other Losses | 1,151.2 | 1,217.1 | 1,246.6 | 1,303.8 | 4,918.7 | 1,204.8 | 1,269.8 | 1,302.0 | 1,427.4 | 5,204.0 |
| Net Operating Income | 7,744.1 | 7,468.4 | 9,500.3 | 9,438.8 | 34,151.6 | 7,228.4 | 7,205.7 | 8,054.0 | 8,538.2 | 31,026.3 |
| Less: Expenses | 4,453.6 | 4,284.9 | 4,761.6 | 4,915.4 | 18,415.5 | 3,998.7 | 3,927.8 | 4,157.7 | 4,431.6 | 16,515.5 |
| Profit Before Income Tax | 3,290.5 | 3,183.5 | 4,738.7 | 4,523.4 | 15,736.1 | 3,229.7 | 3,277.9 | 3,896.4 | 4,106.6 | 14,510.5 |
| Less: Income Tax Expense | 1,011.9 | 983.1 | 1,413.0 | 1,148.0 | 4,556.0 | 989.0 | 1,047.1 | 1,134.0 | 894.9 | 4,065.0 |
| Profit for the Period | 2,278.6 | 2,200.4 | 3,325.7 | 3,375.4 | 11,180.1 | 2,240.7 | 2,230.8 | 2,762.3 | 3,211.7 | 10,445.5 |
| Quarterly profit as a % of the profit after tax | 20.4 | 19.7 | 29.7 | 30.2 | 100.0 | 21.5 | 21.4 | 26.4 | 30.7 | 100.0 |
| Cumulative quarterly profit as a % of the profit after tax | 20.4 | 40.1 | 69.8 | 100.0 | 21.5 | 42.9 | 69.3 | 100.0 | ||
Summary of the Statement of Financial Position
| 2014 | 2013 | |||||||
|
As at Mar. 31 Rs. Mn. |
As at Jun. 30 Rs. Mn. |
As at Sept. 30 Rs. Mn. |
As at Dec. 31 Rs. Mn. |
As at Mar. 31 Rs. Mn. |
As at Jun. 30 Rs. Mn. |
As at Sept. 30 Rs. Mn. |
As at Dec. 31 Rs. Mn. |
|
| Group | ||||||||
| Cash and Cash Equivalents | 18,538.0 | 15,332.2 | 15,789.1 | 20,617.0 | 17,320.3 | 17,242.3 | 12,441.8 | 14,263.3 |
| Placements with Banks | 7,190.8 | 4,981.5 | 4,774.8 | 14,512.6 | 18,392.4 | 1,657.1 | 4,949.3 | 4,131.8 |
| Other Financial Assets – Held-for-Trading | 15,241.7 | 14,941.2 | 9,834.4 | 6,326.6 | 9,822.8 | 10,474.9 | 10,000.5 | 6,379.1 |
| Loans and Receivables to Banks and Other Customers | 418,474.5 | 438,204.2 | 483,937.2 | 498,165.4 | 389,317.2 | 390,085.5 | 400,159.1 | 410,936.0 |
| Financial Investments – Available-for-Sale | 148,107.3 | 167,359.0 | 189,901.9 | 214,225.0 | 59,246.9 | 96,484.7 | 122,607.3 | 131,756.5 |
| Other Assets | 41,051.4 | 43,350.3 | 44,408.8 | 43,411.0 | 43,138.1 | 42,618.8 | 41,752.7 | 39,097.8 |
| 648,603.7 | 684,168.2 | 748,647.3 | 797,257.7 | 537,237.6 | 558,563.3 | 591,910.7 | 606.564.5 | |
| Due to Banks | 9,165.4 | 15,964.1 | 26,791.0 | 25,669.1 | 3,698.4 | 12,254.3 | 13,474.0 | 14,194.2 |
| Due to Other Customers Deposit from Customers | 472,175.2 | 487,506.2 | 504,103.2 | 529,266.6 | 405,173.1 | 417,223.9 | 435,394.0 | 451,098.9 |
| Other Borrowings | 74,948.0 | 85,329.3 | 114,042.7 | 136,027.6 | 46,797.1 | 47,958.5 | 54,684.5 | 53,997.5 |
| Subordinated Liabilities | 11,084.1 | 10,937.8 | 11,374.2 | 11,262.6 | 10,512.1 | 10,934.5 | 11,250.1 | 10,944.4 |
| Other Liabilities | 19,967.7 | 21,140.3 | 22,646.8 | 23,778.5 | 18,062.0 | 14,587.3 | 18,817.6 | 14,844.4 |
| Shareholders’ Funds | 61,263.3 | 63,290.5 | 69,689.3 | 71,253.4 | 52,994.9 | 55,604.8 | 58,290.5 | 61,485.0 |
| 648,603.7 | 684,168.2 | 748,647.3 | 797,257.7 | 537,237.6 | 558,563.3 | 591,910.7 | 606,564.5 | |
| Bank | ||||||||
| Cash and Cash Equivalents | 18,521.8 | 15,316.8 | 15,732.4 | 20,591.9 | 17,345.6 | 17,231.6 | 12,434.9 | 14,261.5 |
| Placements with Banks | 7,190.8 | 4,981.5 | 4,774.8 | 14,507.9 | 18,392.4 | 1,657.1 | 4,949.3 | 4,131.8 |
| Other Financial Assets – Held-for-Trading | 15,241.7 | 14,941.2 | 9,834.4 | 6,326.6 | 9,822.8 | 10,474.9 | 10,000.5 | 6,379.1 |
| Loans and Receivables to Banks and Other Customers | 418,483.0 | 438,209.4 | 482,940.4 | 497,065.8 | 389,450.7 | 390,119.4 | 400,182.9 | 410,951.4 |
| Financial Investments – Available-for-Sale | 148,107.3 | 167,359.0 | 189,885.5 | 214,208.4 | 59,246.9 | 96,484.7 | 122,607.3 | 131,765.5 |
| Other Assets | 40,478.3 | 42,772.1 | 44,121.9 | 42,909.1 | 42,627.0 | 42,143.8 | 41,314.9 | 38,507.3 |
| 648,023.0 | 683,579.9 | 747,289.5 | 795,609.6 | 536,885.3 | 558,111.5 | 591,489.7 | 605,987.6 | |
| Due to Banks | 9,165.4 | 15,964.1 | 26,423.8 | 25,261.0 | 3,698.4 | 12,254.3 | 13,474.0 | 14,194.2 |
| Due to Other Customers | 472,244.6 | 487,598.8 | 504,161.2 | 529,361.5 | 405,246.7 | 417,282.8 | 435,469.3 | 451,152.9 |
| Other Borrowings | 46,947.7 | 85,507.3 | 114,228.1 | 136,201.1 | 46,947.7 | 48,111.8 | 54,867.2 | 54,173.2 |
| Subordinated Liabilities | 11,084.1 | 10,937.8 | 11,156.4 | 11,044.8 | 10,512.1 | 10,934.5 | 11,250.1 | 10,944.4 |
| Other Liabilities | 47,882.0 | 20,859.3 | 22,236.3 | 23,229.6 | 17,922.0 | 14,371.9 | 18,581.2 | 14,578.9 |
| Shareholders' Funds | 60,699.2 | 62,712.6 | 69,083.8 | 70,511.7 | 52,558.4 | 55,156.2 | 57,848.0 | 60,944.0 |
| 648,023.0 | 683,579.9 | 747,289.5 | 795,609.6 | 536,885.3 | 558,111.5 | 591,489.7 | 605,987.6 | |
2. Stock Exchange Listing
The following Securities of the Bank are listed on the Main Board of the CSE:
| Shares | Ordinary Shares - Voting | |
| Ordinary Shares - Non-Voting | ||
| Debentures | Fixed Rate |
|
| Floating Rate |
|
The unaudited Interim Financial Statements for the first three quarters of 2014 were submitted to the CSE within 45 days from the respective quarter ends as required by the Rule No. 7.4 (a) (i) of the Listing Rules of the CSE. (The Bank duly complied with this requirement for 2013).
The unaudited Interim Financial Statements for the fourth quarter of 2014 was submitted to the CSE on February 23, 2015, as required by the Rule No. 7.4 (a) (i) of the Listing Rules of the CSE. (The Bank duly complied with this requirement for 2013).
The Audited Income Statement for the year ended December 31, 2014 and the Audited Statement of Financial Position as at December 31, 2014 will be submitted to the CSE within three months from the year end, which is well within the required deadline as required by the Rule No. 7.5 (a) of the Listing Rules of the CSE. (The Bank duly complied with this requirement for 2013).
3. Information on Share Trading
| Ordinary Shares Voting | Ordinary Shares Non-Voting | |||
| 2014 | 2013 | 2014 | 2013 | |
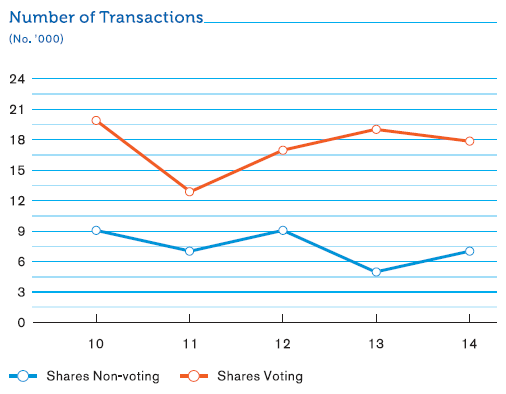
| Number of Transactions | 17,846 | 18,733 | 7,382 | 5,341 |
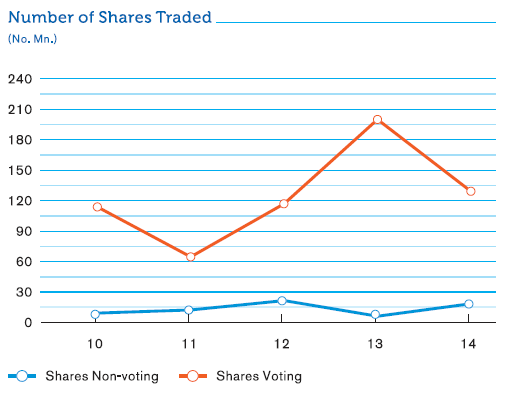
| Number of Shares Traded | 129,328,356 | 198,501,282 | 19,648,816 | 6,769,927 |
| Value of Shares Traded (Rs. Bn.) | 18.34 | 22.04 | 2.09 | 0.63 |
4. The Names, Number and Percentage of Shares held by Twenty Largest Shareholders (As per Rule No. 7.6 (iii) of the Listing Rules of the CSE).
| As at December 31, | 2014 | 2013(*) | |||
| Ordinary Shares Voting |
No. of Shareholders |
% |
No. of Shareholders |
% | |
| 1. |
DFCC Bank A/C 1 |
119,806,122 | 14.79 | 117,951,857 | 14.85 |
| 2. |
Employees’ Provident Fund |
78,806,032 | 9.73 | 77,586,335 | 9.76 |
| 3. |
HSBC International Nominees Ltd. - JPMLU - Franklin Templeton Investment Funds |
47,984,547 | 5.92 | 57,224,769 | 7.20 |
| 4. |
Mr. Y.S.H.I. Silva |
47,355,714 | 5.84 | 36,000,446 | 4.53 |
| 5. |
Sri Lanka Insurance Corporation Ltd. - Life Fund
|
40,851,867 | 5.04 | 40,219,594 | 5.06 |
| 6. |
CB NY S/A International Finance Corporation |
40,381,198 | 4.98 | 39,756,210 | 5.00 |
| 7. |
Sri Lanka Insurance Corporation Ltd. - General Fund
|
35,126,985 | 4.34 | 34,583,318 | 4.35 |
| 8. |
HSBC International Nominees Ltd. - SSBT- Wasatch Frontier - Emerging Small Countries Fund |
20,383,126 | 2.52 | 15,136,477 | 1.92 |
| 9. |
Melstacorp Ltd. |
18,989,272 | 2.34 | 1,346,563 | 0.17 |
| 10. |
HSBC International Nominees Ltd. - BPSS - LUX - Aberdeen Global - Asian Smaller Companies Fund |
15,177,533 | 1.87 | 17,786,191 | 2.24 |
| 11. |
Ms. L.E.M. Yaseen |
14,000,030 | 1.73 | 11,675,901 | 1.47 |
| 12. |
HSBC International Nominees Ltd - JPMLU - Schroder International Selection Fund |
12,012,366 | 1.48 | 2,520,212 | 0.32 |
| 13. |
HSBC International Nominees Ltd. - SSBT - Morgan Stanley Institutional Fund, Inc. Frontier Emerging Markets Portfolio |
11,295,245 | 1.39 | 3,303,524 | 0.42 |
| 14. |
Northern Trust Co S/A Harding Loevner Frontier Emerging Markets Portfolio |
11,250,000 | 1.39 | 6,850,000 | 0.86 |
| 15. |
HSBC International Nominees Ltd. - BPSS - LUX - Aberdeen Global Asia Pacific Equity Fund |
10,905,077 | 1.35 | 10,736,297 | 1.35 |
| 16. |
Mercantile Investments and Finance PLC |
10,405,566 | 1.28 | 10,244,517 | 1.29 |
| 17. |
The Bank of New York Mellon SA/NV - CF Ruffer Total Return Fund |
8,198,498 | 1.01 | 8,071,609 | 1.02 |
|
18. |
HSBC International Nominees Ltd. - SSBT - Morgan Stanley Asset Management SA Acting on behalf of Morgan Stanley Galaxy Fund |
8,094,018 | 1.00 | 7,398,991 | 0.93 |
| 19. |
HSBC International Nominees Ltd. - SSBT - Aberdeen Institutional Commingled Funds, LLC |
7,769,156 | 0.96 | 6,960,323 | 0.89 |
| 20. |
HSBC International Nominees Ltd. - BP2S London- Aberdeen Asia Smaller Companies Investment Trust |
6,777,581 | 0.84 | 6,672,683 | 0.84 |
|
Sub Total |
565,569,933 | 69.80 | 512,025,817 | 64.46 | |
|
Other Shareholders |
244,707,796 | 30.20 | 282,510,002 | 35.54 | |
|
Total |
810,277,729 | 100.00 | 794,535,819 | 100.00 | |
As per Rule No. 7.6 (iv) of the Listing Rules of the CSE, percentage of public holding of voting shares as at December 31, 2014 was 99.57% (85.01% as at December 31, 2013).
As per Rule No. 7.13.1 of the Listing Rules of the CSE, No. of shareholders representing public holding as at December 31, 2014 - 8,349 (9,072 as at December 31, 2013).
* Comparative shareholdings as at December 31, 2013 of the twenty largest shareholders as at December 31, 2014.
| As at December 31, | 2014 | 2013 (*) | |||
| Ordinary Shares Non Voting |
No. of Shareholders |
% |
No. of Shareholders |
% | |
| 1. |
HSBC International Nominees Ltd. - JPMLU - Franklin Templeton Investment Funds |
3,215,179 | 5.78 | 3,286,705 | 6.03 |
| 2. |
Mr.Y.S.H.I. Indrakumara |
2,360,842 | 4.25 | – | – |
| 3. |
Citibank NY S/A Forward International Dividend Fund |
1,926,649 | 3.47 | 1,800,733 | 3.30 |
| 4. |
GF Capital Global Ltd. |
1,545,795 | 2.78 | 1,516,962 | 2.78 |
| 5. |
HINL - JPMCB - Butterfield Trust (Bermuda) Ltd. |
1,379,083 | 2.48 | 1,353,360 | 2.48 |
| 6. |
Mr. J.D. Bandaranayake |
1,098,285 | 1.98 | 1,077,799 | 1.98 |
| 7. |
Citibank NY S/A Forward Select EM Dividend Fund |
1,016,446 | 1.83 | 618,000 | 1.13 |
| 8. |
Waldock Mackenzie Ltd. / Mr. S.N.P. Palihena and Ms. A.S. Palihena |
1,000,000 | 1.80 | 1,000,000 | 1.83 |
| 9. |
M.J.F. Exports Ltd. |
950,795 | 1.71 | 933,060 | 1.71 |
| 10. |
Northern Trust Company S/A Polar Capital Funds PLC |
919,031 | 1.65 | 778,280 | 1.43 |
| 11. |
Employees’ Trust Fund Board |
882,181 | 1.59 | 126,470 | 0.23 |
| 12. |
Saboor Chatoor (Pvt) Ltd. |
751,000 | 1.35 | 687,000 | 1.26 |
| 13. |
Mr. M.F. Hashim |
746,733 | 1.34 | 689,800 | 1.26 |
| 14. |
Beta Holdings Ltd. |
698,000 | 1.26 | – | – |
| 15. |
Ms. L.V.C. Samarasinha |
600,000 | 1.08 | 457,144 | 0.8 |
| 16. |
Union Assurance PLC - A/C 01 |
565,107 | 1.02 | 429,739 | 0.79 |
| 17. |
Akbar Brothers (Pvt) Ltd. A/C 1 |
560,349 | 1.01 | 487,940 | 0.89 |
| 18. |
Asian Alliance Insurance PLC - A/C 02 - Life Fund |
504,482 | 0.91 | 495,072 | 0.91 |
| 19. |
Dr. A.K.A. Jayawardene |
490,623 | 0.88 | 481,472 | 0.89 |
| 20. |
Mr. G.R. Mallawaaratchy/Ms. B.G.P. Mallawaaratchy |
446,527 | 0.80 | 433,880 | 0.80 |
|
Sub Total |
21,657,107 | 38.97 | 16,653,416 | 30.52 | |
|
Other Shareholders |
33,922,839 | 61.03 | 37,889,806 | 69.48 | |
|
Total |
55,579,946 | 100.00 | 54,543,222 | 100.00 | |
As per Rule No. 7.6 (iv) of the Listing Rules of the CSE, percentage of public holding of non-voting shares as at December 31, 2014 was 99.79% (99.94% as at December 31, 2013).
As per Rule No. 7.13.1 of the Listing Rules of the CSE, No. of shareholders representing public holding as at December 31, 2014 - 4,131 (4,331 as at December 31, 2013).
* Comparative shareholdings as at December 31, 2013 of the twenty largest shareholders as at December 31, 2014.
5. Directors’ Shareholding Including the Chief Executive Officer's Shareholding(As per Rule No. 7.6 (V) of the Listing Rules of the Colombo Stock Exchange)
| Ordinary Shares Voting | Ordinary Shares Non-Voting | ||||
| As at December 31, | 2014 | 2013 | 2014 | 2013 | |
| 1. |
Mr. K.G.D.D. Dheerasinghe (Chairman) |
20,653 | 20,334 | Nil | Nil |
| 2. |
Mr. M.P. Jayawardena (Deputy Chairman) |
Nil | Nil | Nil | Nil |
| 3. |
Mr. J. Durairatnam (MD/CEO) |
379,087 | 344,336 | Nil | Nil |
| 4. |
Prof. U.P. Liyanage |
Nil | Nil | Nil | Nil |
| 5. |
Mr. L. Hulugalle |
Nil | Nil | Nil | Nil |
| 6. |
Mr. S. Swarnajothi |
Nil | Nil | 8,490 | 8,332 |
| 7. |
Mr. H.J. Wilson |
Nil | Nil | Nil | Nil |
| 8. |
Mr. S. Renganathan |
190,034 | 197,093 | 10,190 | Nil |
| 9. |
Mr. K.M.M. Siriwardana (Ceased to hold office w.e.f. February 23, 2015) |
Nil | Nil | Nil | Nil |
6. Material Foreseeable Risk Factors (As per Rule No. 7.6 (vi) of the Listing Rules of the Colombo Stock Exchange)
Information pertaining to the material foreseeable risk factors, that require disclosures as per the Rule No. 7.6 (vi) of the Listing Rules of the CSE are discussed in the section on ‘Managing Risk at Commercial Bank’.
7. Material Issues Pertaining to Employees and Industrial Relations Pertaining to the Bank(As per Rule No. 7.6 (vii) of the Listing Rules of the Colombo Stock Exchange)
There were no material issues pertaining to employees and industrial relations pertaining to the Bank that occurred during the year under review which need to be disclosed.
8. Information on Movement in Number of Shares Represented by the Stated Capital(As per Rule No. 7.6 (ix) of the Listing Rules of the Colombo Stock Exchange)
| No. of Shares | |||||||
| Year | Details | Basis |
No. of Shares Issued/ (Redeemed) |
Ordinary Shares Voting |
Ordinary Shares Non-Voting |
Cumulative Redeemable Preference Shares |
|
| 1987 |
As at December 31, 1987 |
3,000,000 | – | – | |||
| 1988 |
Bonus Issue |
Voting |
2 for 3 | 2,000,000 | 5,000,000 | – | – |
| 1990 |
Bonus Issue |
Voting |
1 for 1 | 5,000,000 | 10,000,000 | – | – |
| 1993 |
Rights Issue |
Voting |
1 for 4 | 2,500,000 | 12,500,000 | – | – |
| 1996 |
Bonus Issue |
Voting |
3 for 5 | 7,500,000 | 20,000,000 | – | – |
|
Rights Issue |
Voting |
1 for 4 | 5,000,000 | 25,000,000 | – | – | |
|
Share Swap |
Non-Voting |
894,275 | 25,000,000 | 894,275 | – | ||
|
Bonus Issue |
Non-Voting |
3 for 5 | 536,565 | 25,000,000 | 1,430,840 | – | |
|
Rights Issue |
Non-Voting |
1 for 4 | 357,710 | 25,000,000 | 1,788,550 | – | |
| 1998 |
Bonus Issue |
Voting |
3 for 10 | 7,500,000 | 32,500,000 | 1,788,550 | – |
|
Bonus Issue |
Non-Voting |
3 for 10 | 536,565 | 32,500,000 | 2,325,115 | – | |
| 2001 |
Bonus Issue |
Voting |
1 for 5 | 6,500,000 | 39,000,000 | 2,325,115 | – |
|
Bonus Issue |
Non-Voting |
1 for 5 | 465,023 | 39,000,000 | 2,790,138 | – | |
|
Issue of Cumulative Redeemable Preference Shares |
90,655,500 | 39,000,000 | 2,790,138 | 90,655,500 | |||
| 2003 |
Bonus Issue |
Voting |
1 for 3 | 13,000,000 | 52,000,000 | 2,790,138 | 90,655,500 |
|
Rights Issue |
Voting |
1 for 4 | 13,000,000 | 65,000,000 | 2,790,138 | 90,655,500 | |
|
Bonus Issue |
Non-Voting |
1 for 3 | 930,046 | 65,000,000 | 3,720,184 | 90,655,500 | |
|
Rights Issue |
Non-Voting |
1 for 4 | 930,046 | 65,000,000 | 4,650,230 | 90,655,500 | |
|
Issue of Cumulative Redeemable Preference Shares |
100,000,000 | 65,000,000 | 4,650,230 | 190,655,500 | |||
| 2004 |
ESOP |
Voting |
29,769 | 65,029,769 | 4,650,230 | 190,655,500 | |
| 2005 |
ESOP |
Voting |
1,361,591 | 66,391,360 | 4,650,230 | 190,655,500 | |
|
Bonus Issue |
Voting |
1 for 1 | 66,389,162 | 132,780,522 | 4,650,230 | 190,655,500 | |
|
Bonus Issue |
Non-Voting |
1 for 1 | 4,650,230 | 132,780,522 | 9,300,460 | 190,655,500 | |
| 2006 |
ESOP |
Voting |
737,742 | 133,518,264 | 9,300,460 | 190,655,500 | |
|
Redemption of Cumulative Redeemable Preference Shares |
(90,655,500) | 133,518,264 | 9,300,460 | 100,000,000 | |||
| 2007 |
Rights Issue |
Voting |
3 for 10 | 40,288,996 | 173,807,260 | 9,300,460 | 100,000,000 |
|
Bonus Issue |
Voting |
1 for 3 | 58,204,268 | 232,011,528 | 9,300,460 | 100,000,000 | |
|
ESOP |
Voting |
919,649 | 232,931,177 | 9,300,460 | 100,000,000 | ||
|
Rights Issue |
Non-Voting |
3 for 10 | 2,790,138 | 232,931,177 | 12,090,598 | 100,000,000 | |
|
Bonus Issue |
Non-Voting |
1 for 3 | 4,030,199 | 232,931,177 | 16,120,797 | 100,000,000 | |
| 2008 |
Redemption of Cumulative Redeemable Preference Shares |
(100,000,000) | 232,931,177 | 16,120,797 | – | ||
|
ESOP |
Voting |
350,049 | 233,281,226 | 16,120,797 | – | ||
| 2009 |
ESOP |
Voting |
540,045 | 233,821,271 | 16,120,797 | – | |
| 2010 |
Share Split |
Voting |
1 for 2 | 117,402,608 | 351,223,879 | 16,120,797 | – |
|
Share Split |
Non-Voting |
1 for 2 | 8,060,398 | 351,223,879 | 24,181,195 | – | |
|
ESOP |
Voting |
2,081,508 | 353,305,387 | 24,181,195 | – | ||
| 2011 |
Scrip Issue for Final Dividend 2010 |
Voting |
2,277,195 | 355,582,582 | 24,181,195 | – | |
|
Scrip Issue for Final Dividend 2010 |
Non-Voting |
255,734 | 355,582,582 | 24,436,929 | – | ||
|
ESOP |
Voting |
1,457,645 | 357,040,227 | 24,436,929 | – | ||
|
Rights Issue |
Voting |
1 for 14 | 25,502,433 | 382,542,660 | 24,436,929 | – | |
|
Rights Issue |
Non-Voting |
1 for 14 | 1,745,494 | 382,542,660 | 26,182,423 | – | |
|
Share Split |
Voting |
1 for 1 | 382,542,660 | 765,085,320 | 26,182,423 | – | |
|
Share Split |
Non-Voting |
1 for 1 | 26,182,423 | 765,085,320 | 52,364,846 | – | |
| 2012 |
Scrip Issue for Final Dividend 2011 |
Voting |
13,587,144 | 778,672,464 | 52,364,846 | – | |
|
Scrip Issue for Final Dividend 2011 |
Non-Voting |
1,108,902 | 778,672,464 | 53,473,748 | – | ||
|
ESOP |
Voting |
1,341,768 | 780,014,232 | 53,473,748 | – | ||
| 2013 |
Scrip issue for Final Dividend 2012 |
Voting |
13,076,189 | 793,090,421 | 53,473,748 | – | |
|
Scrip issue for Final Dividend 2012 |
Non-Voting |
1,069,474 | 793,090,421 | 54,543,222 | – | ||
|
ESOP |
Voting |
1,445,398 | 794,535,819 | 54,543,222 | – | ||
| 2014 |
Scrip issue for Final Dividend 2013 |
Voting |
12,504,344 | 807,040,163 | 54,543,222 | – | |
|
Scrip issue for Final Dividend 2013 |
Non-Voting |
1,036,724 | 807,040,163 | 55,579,946 | – | ||
|
ESOP |
Voting |
3,237,566 | 810,277,729 | 55,579,946 | – | ||
9. Distribution Schedule of the Number of Holders and Percentage of Holding in Each Class of Equity Securities (As Per Rule No. 7.6 (X) of the Listing Rules Colombo Stock Exchange)
| As at December 31, 2014 | As at December 31, 2013 | |||||||||
|
No. of Shareholders |
% | No. of Shares | % |
No. of Shareholders |
% | No. of Shares | % | |||
| Ordinary Shares Voting | ||||||||||
|
1 |
- | 1,000 | 4,033 | 48.16 | 985,748 | 0.12 | 4,257 | 46.83 | 1,070,676 | 0.13 |
|
1,001 |
- | 10,000 | 2,683 | 32.04 | 10,067,965 | 1.24 | 3,028 | 33.31 | 11,127,681 | 1.40 |
|
10,001 |
- | 100,000 | 1,380 | 16.48 | 40,455,736 | 4.99 | 1,503 | 16.53 | 43,110,082 | 5.43 |
|
100,001 |
- | 1,000,000 | 206 | 2.46 | 61,331,081 | 7.57 | 229 | 2.52 | 63,934,905 | 8.05 |
|
Over |
1,000,000 | 72 | 0.86 | 697,437,199 | 86.08 | 74 | 0.81 | 675,292,475 | 84.99 | |
| Total | 8,374 | 100.00 | 810,277,729 | 100.00 | 9,091 | 100.00 | 794,535,819 | 100.00 | ||
| Ordinary Shares Non-Voting | ||||||||||
|
1 |
- | 1,000 | 2,163 | 52.24 | 564,960 | 1.02 | 2,274 | 52.44 | 604,911 | 1.11 |
|
1,001 |
- | 10,000 | 1,359 | 32.83 | 4,533,671 | 8.15 | 1,424 | 32.84 | 4,798,522 | 8.79 |
|
10,001 |
- | 100,000 | 515 | 12.44 | 14,051,351 | 25.28 | 534 | 12.32 | 14,655,746 | 26.87 |
|
100,001 |
- | 1,000,000 | 96 | 2.32 | 23,887,685 | 42.99 | 98 | 2.26 | 24,145,146 | 44.27 |
|
Over |
1,000,000 | 7 | 0.17 | 12,542,279 | 22.56 | 6 | 0.14 | 10,338,897 | 18.96 | |
| Total | 4,140 | 100.00 | 55,579,946 | 100.00 | 4,336 | 100.00 | 54,543,222 | 100.00 | ||
10. Information on Ratios, Market Prices of Shares and Credit Ratings(As per Rule No. 7.6 (XI) of the Listing Rules of the Colombo Stock Exchange)
(a) Information on Ratios
| 2014 | 2013 | |||
| Dividend per Share (Rs.) | Cash |
First Interim Paid |
1.50 | 1.50 |
|
Second Interim Paid |
1.00 | 1.00 | ||
|
Final Proposed*/Paid |
2.00 | 2.00 | ||
|
Total |
4.50 | 4.50 | ||
| Issue and Allotment of Shares |
Final Proposed*/Allotted |
2.00 | 2.00 | |
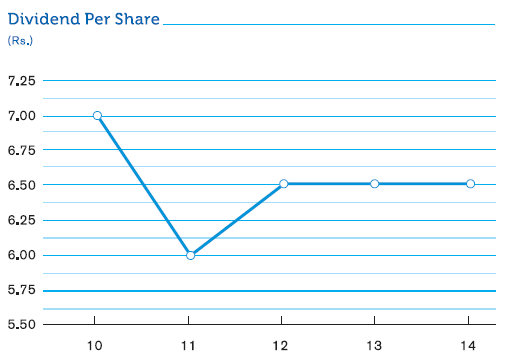
| Total Dividend | 6.50 | 6.50 | ||
| Dividend Payout Ratio (%) | Cash | 34.85 | 36.60 | |
| Total (Cash and Shares) | 50.34 | 52.87 | ||
| Net Assets Value per Share (Rs.) | 81.44 | 71.78 |
* The Board of Directors of the Bank has recommended a final dividend of Rs. 4.00 per ordinary share, which consists of a cash dividend of Rs. 2.00 per share and the balance entitlement of Rs. 2.00 per share satisfied in the form of issue and allotment of new shares for both voting and non-voting shareholders of the Bank for the year ended December 31, 2014 for approval by the shareholders at the 46th Annual General Meeting (AGM), to be held on March 31, 2015. (The Bank declared a final dividend of Rs. 4.00 per share for the year ended December 31, 2013 which consists of a cash dividend of Rs. 2.00 per share and balance entitlement of Rs. 2.00 per share satisfied in the form of issue and allotment of new shares).
(b) Market Prices
| Ordinary Shares Voting | Ordinary Shares Non-Voting | |||
|
2014 Rs. |
2013 Rs. |
2014 Rs. |
2013 Rs. |
|
| Highest Price | 179.90 | 126.00 | 125.50 | 102.00 |
| Date of the Highest Price | (18.11.2014) | (21.05.2013) | (31.12.2014) | (21.05.2013) |
| Lowest Price | 113.50 | 103.20 | 91.30 | 87.00 |
| Date of the Lowest Price | (24.02.2014) | (02.01.2013) | (01.04.2014) | (04.12.2013) |
| Year-end Price | 171.00 | 120.40 | 125.10 | 93.00 |
(c) Other Ratios
| 2014 | 2013 | |
| Debt Equity Ratio (%) | 25.97 | 33.17 |
| Interest Cover (Times) | 28.31 | 20.25 |
| Liquid Assets Ratio (%) (Minimum 20%) | 33.11 | 34.05 |
(d) Debenture Composition
| Fixed Interest Rate | Floating Interest Rate | |||||
| 2014 | 2013 | 2014 | 2013 | |||
| Type of Issue | Private | Public | Private | Public | Public | Public |
| Debenture Type | - N/A - | Type ‘A’ | - N/A - | Type ‘A’ | Type ‘D’ | Type ‘D’ |
| CSE Listing | Not listed | Listed | Not listed | Listed | Listed | Listed |
| Issue Date | May 2006 | Dec. 2006 | May 2006 | Dec. 2006 | Dec. 2006 | Dec. 2006 |
| Maturity Date | May 2016 | Dec. 2016 | May 2016 | Dec. 2016 | Dec. 2016 | Dec. 2016 |
| Interest Payable Frequency | Annually | Annually | Annually | Annually | Annually | Annually |
| Offered Interest Rate | 13.25% p.a. | 14.00% p.a. | 13.25% p.a. | 14.00% p.a. |
12 Months TB Rate (Gross) + 1% p.a. |
12 Months TB Rate (Gross) + 1% p.a. |
| Amount (Rs. Mn.) | 505.000 | 467.260 | 505.000 | 467.260 | 0.400 | 0.400 |
| Market Values | ||||||
| - Highest (Rs.) | - N/A - | Not traded | - N/A - | Not traded | Not traded | Not traded |
| - Lowest (Rs.) | - N/A - | during the | - N/A - | during the | during the | during the |
| - Year-end (Rs.) | - N/A - | year | - N/A - | year | year | year |
| Interest Rates | ||||||
| - Coupon Rate (%) | 13.25 | 14.00 | 13.25 | 14.00 | 10.21 | 13.99 |
| - Effective Annual Yield (%) | 13.25 | 14.00 | 13.25 | 14.00 | 10.21 | 13.99 |
| Interest rate of comparable Government Security | 6.35 | 6.70 | 8.85 | 9.10 | 7.70 | 10.20 |
| Other Ratios as at date of last trade | ||||||
| - Interest Yield (%) | - N/A - |
Not traded during the year |
- N/A - |
Not traded during the year |
Not traded during the year |
Not traded during the year |
| - Yield to Maturity (%) | - N/A - | - N/A - | ||||
12 months TB rate (Gross) - Twelve months Treasury Bill rate before 10% withholding tax rate as published by the Central Bank of Sri Lanka immediately prior to the commencement of each interest period.
(e) Credit Ratings
- The Bank’s credit rating, AA(lka) was reaffirmed by Fitch Ratings Lanka Ltd. in 2014
- The Bank’s credit rating, AAA was affirmed by Lanka Rating Agency Ltd. [formally known as RAM Ratings (Lanka) Ltd.] in 2014.
- The Bank’s Bangladesh operation’s credit rating was reaffirmed as AAA by Credit Rating Information Services Ltd. in 2014
(f) Credit Ratings - Debentures
- The credit rating of the Bank’s subordinated debentures, AA- (lka) too reaffirmed in 2014 by Fitch Ratings Lanka Ltd.
11. Information on Scrip Issues, Rights Issues and Share Splits
| Year/Month | Details |
| 2014 April | Issue of ordinary shares to satisfy a part of the final dividend for 2013 of Rs. 2.00 per ordinary share |
| 2013 April | Issue of ordinary shares to satisfy a part of the final dividend for 2012 of Rs. 2.00 per ordinary share |
| 2012 April | Issue of ordinary shares to satisfy a part of the final dividend for 2011 of Rs. 2.00 per ordinary share |
| 2011 September | Share split of one ordinary share for every one ordinary share held immediately after the right issue |
| 2011 August | Rights issue of one ordinary share for every fourteen ordinary shares held |
| 2011 April | Issue of ordinary shares to satisfy a part of the final dividend for 2010 of Rs. 2.00 per ordinary share |
| 2010 June | Share split of one ordinary share for every two ordinary shares held |
| 2007 June | Scrip issue of one ordinary share for every three ordinary shares held |
| 2007 April | Rights issue of three ordinary shares for every ten ordinary shares held |
| 2005 June | Scrip issue of one ordinary share for every one ordinary share held |
| 2003 October | Rights issue of one ordinary share for every four ordinary shares held |
| 2003 May | Scrip issue of one ordinary share for every three ordinary shares held |
| 2001 May | Scrip issue of one ordinary share for every five ordinary shares held |
| 1998 June | Scrip issue of three ordinary shares for every ten ordinary shares held |
12. Shareholder Base
| 2014 | 2013 | |
| Number of Ordinary Voting Shareholders | 8,374 | 9,091 |
| Number of Ordinary Non-voting Shareholders | 4,140 | 4,336 |
| Total | 12,514 | 13,427 |
13. Composition of Shareholders
| As at December 31, 2014 | As at December 31, 2013 | |||||||
|
No. of Shareholders |
% | No. of Shares | % |
No. of Shareholders |
% | No. of Shares | % | |
| Ordinary Shares Voting | ||||||||
| Resident | 8,065 | 96.31 | 504,235,468 | 62.23 | 8,789 | 96.68 | 511,640,873 | 64.39 |
| Non-Resident | 309 | 3.69 | 306,042,261 | 37.77 | 302 | 3.32 | 282,894,946 | 35.61 |
| Total | 8,374 | 100.00 | 810,277,729 | 100.00 | 9,091 | 100.00 | 794,535,819 | 100.00 |
| Individuals | 7,878 | 94.08 | 149,595,615 | 18.46 | 8,546 | 94.01 | 142,086,949 | 17.88 |
| Institutions | 496 | 5.92 | 660,682,114 | 81.54 | 545 | 5.99 | 652,448,870 | 82.12 |
| Total | 8,374 | 100.00 | 810,277,729 | 100.00 | 9,091 | 100.00 | 794,535,819 | 100.00 |
| Ordinary Shares Non-Voting | ||||||||
| Resident | 4,057 | 98.00 | 43,842,309 | 78.88 | 4,233 | 97.62 | 42,218,874 | 77.40 |
| Non-Resident | 83 | 2.00 | 11,737,637 | 21.12 | 103 | 2.38 | 12,324,348 | 22.60 |
| Total | 4,140 | 100.00 | 55,579,946 | 100.00 | 4,336 | 100.00 | 54,543,222 | 100.00 |
| Individuals | 3,941 | 95.19 | 34,736,840 | 62.50 | 4,119 | 95.00 | 32,321,004 | 59.26 |
| Institutions | 199 | 4.81 | 20,843,106 | 37.50 | 217 | 5.00 | 22,222,218 | 40.74 |
| Total | 4,140 | 100.00 | 55,579,946 | 100.00 | 4,336 | 100.00 | 54,543,222 | 100.00 |
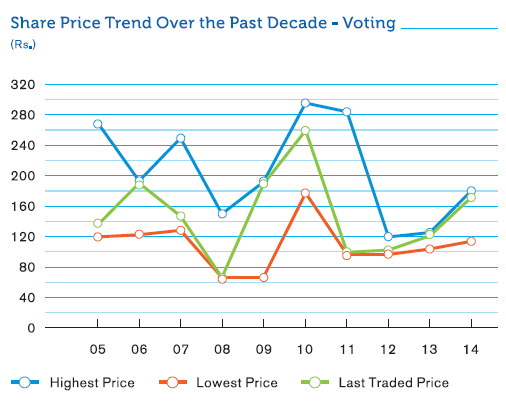
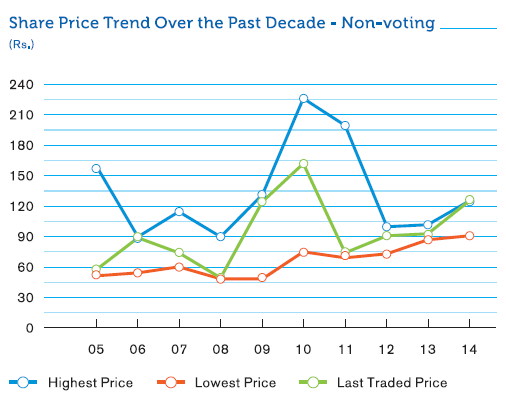
14. Share Price Trend Over Last Ten Years
| Year | 2014 | 2013 | 2012 | 2011 | 2010 | 2009 | 2008 | 2007 | 2006 | 2005 |
| Ordinary Shares Voting | ||||||||||
| Highest Price (Rs.) | 179.90 | 126.00 | 119.50 | 284.00 | 295.00 | 192.00 | 149.75 | 250.00 | 192.50 | 269.00 |
| Lowest Price (Rs.) | 113.50 | 103.20 | 96.80 | 97.00 | 178.00 | 66.00 | 66.25 | 128.00 | 123.00 | 120.00 |
| Last Traded Price (Rs.) | 171.00 | 120.40 | 103.00 | 100.00 | 259.90 | 189.50 | 67.00 | 147.00 | 190.00 | 135.50 |
| Ordinary Shares Non-Voting | ||||||||||
| Highest Price (Rs.) | 125.50 | 102.00 | 99.50 | 200.00 | 226.00 | 131.25 | 89.50 | 114.50 | 90.00 | 160.00 |
| Lowest Price (Rs.) | 91.30 | 87.00 | 73.00 | 69.10 | 75.00 | 48.25 | 48.00 | 60.00 | 54.00 | 51.00 |
| Last Traded Price (Rs.) | 125.10 | 93.00 | 91.10 | 74.50 | 162.00 | 124.75 | 49.00 | 74.50 | 89.00 | 57.50 |
Share Price Trend Over the Past Decade - Voting
Share Price Trend Over the Past Decade - Non-Voting
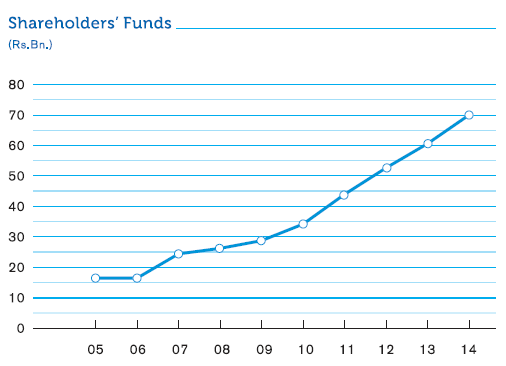
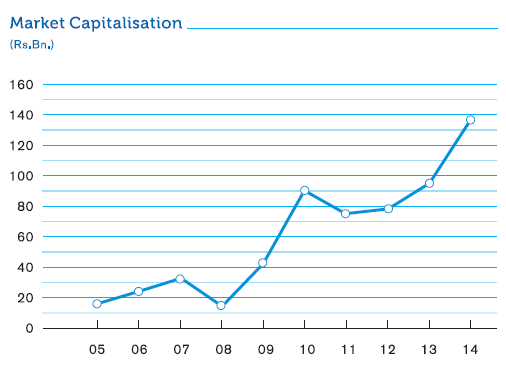
15. Information on Shareholders’ Funds and Market Capitalisation
|
Shareholders' Funds |
Com Bank's Market Capitalisation (*) |
Total Market Capitalisation of the CSE |
Com Bank's Market Capitalisation as a % of CSE Market Capitalisation |
Com Bank's Market Capitalisation Ranking |
|
| As at December 31, | Rs. Mn. | Rs. Mn. | Rs. Mn. | % | Rank |
| 2014 | 70,512 | 138,557 | 3,104,864 | 4.76 | 3 |
| 2013 | 60,944 | 95,654 | 2,286,320 | 4.11 | 4 |
| 2012 | 52,577 | 80,341 | 2,167,581 | 3.71 | 5 |
| 2011 | 43,765 | 76,509 | 2,268,854 | 3.37 | 6 |
| 2010 | 33,965 | 91,824 | 2,280,874 | 4.03 | 4 |
| 2009 | 28,499 | 44,309 | 1,092,138 | 4.06 | 5 |
| 2008 | 25,891 | 15,630 | 488,813 | 3.20 | 4 |
| 2007 | 23,937 | 34,234 | 820,652 | 4.17 | 4 |
| 2006 | 15,843 | 25,368 | 834,763 | 3.04 | 5 |
| 2005 | 15,768 | 17,991 | 583,786 | 3.08 | 4 |
* Commercial Bank’s Market Capitalization includes only Voting Ordinary Shares.