Financial Review
With our long history of proven track record (refer ‘Decade at a Glance’), and the recognition and trust that such consistently strong performance has built, Commercial Bank of Ceylon PLC is well-established as Sri Lanka’s benchmark private sector bank. Among our valued stakeholders and the public generally, we have been regularly recognised and rewarded for our sound financial management, ethical business practices, good corporate governance, accountability and transparency, and much more.
In Commercial Bank’s early years, we catered to a highly specialised market, focusing on trade finance facilities. Today, we are acknowledged leaders in the retail banking arena, responsive to needs of our customers and proud to share in their success. The following indicators demonstrate our progress over the period from 2009 to 2014.
| For the Year Ended/As at December 31, | Growth Over 2009 Rs. Mn. |
CAGR*** (5 Years) % |
||
| 2014* Rs. Mn. |
2009** Rs. Mn. |
|||
| Post-tax profits | 11,180.2 | 4,305.0 | 6,875.2 | 21.03 |
| Deposits | 529,361.5 | 234,744.7 | 294,616.8 | 17.66 |
| Loans & advances (Gross) | 463,586.3 | 178,891.3 | 284,695.0 | 20.98 |
| Interest earning assets | 734,661.4 | 292,042.8 | 442,618.6 | 20.26 |
| Interest bearing liabilities | 638,787.0 | 258,195.4 | 380,591.6 | 19.86 |
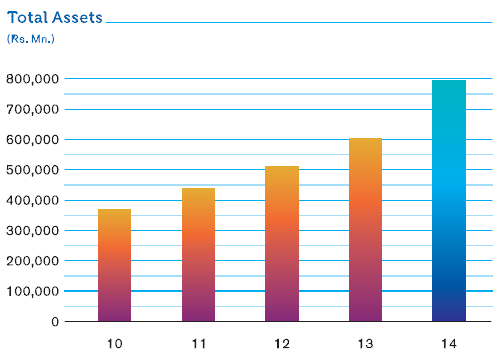
| Total assets | 795,609.6 | 322,314.7 | 473,294.9 | 19.81 |
| No. of branches | 257 | 187 | 70 | – |
| No. of ATMs | 625 | 368 | 257 | – |
| No. of employees | 4,852 | 4,071 | 781 | – |
* Based on SLFRS/LKAS ** Based on SLAS *** Compound Annual Growth Rate
Year after year, the Bank has generated improved results in both profits and business volumes. We have expanded our operations to all areas of the country and also established a presence in Bangladesh. Currently, we have a market share of approximately 11% to 12% within Sri Lanka’s banking sector, measured by assets, deposits and advances.
Propelled forward by the momentum from past achievements, we moved into 2014 well-prepared to navigate the seas of strong competition in the banking industry. After setting ambitious targets at the beginning of the year via the Corporate Plan and Budget, we leveraged our extensive resources and focused all of our efforts on achieving budgeted targets through organic growth. A detailed analysis of our 2014 financial performance follows in this section of the Annual Report.
All financial disclosures herein are based on the Sri Lanka Accounting Standards (SLFRS/LKAS), except a few areas which have been analysed based on management accounts prepared in accordance with the Central Bank of Sri Lanka (CBSL) guidelines. Data for 2011 – 2014 is based on SLFRS/LKAS; all results prior to that period were based on previous accounting standards.
Profitability
The Bank performed exceptionally well in 2014, earning more than Rs. 10.0 Bn. in post-tax profits for the third consecutive year. We sustained this high level of performance despite the less-than-conducive macroeconomic conditions affecting Sri Lanka during the year. Continuing the trend that prevailed in the latter part of 2013, the country’s banking industry experienced low demand for credit, especially during the first two quarters - mainly because of muted credit growth in the private sector, as revealed in data released by the CBSL. As well, the Bank’s restrictive approach to pawning advances contributed to overall slow growth in advances.
As a result of this situation, earning assets shifted to low-yield Government Securities for most of 2014, as the majority of banks compelled to maintain high liquid asset ratios relative to the statutory minimum of 20%. At the same time, Sri Lanka’s banking sector experienced an increase in non-performing advances (NPAs), except pawning.
Growth over the previous year in Bank’s pre-tax and post-tax profits is summarised below:
| For the Year Ended | Growth Over 2013 | |||
| 2014 Rs. Mn. |
2013 Rs. Mn. |
Rs. Mn. | % | |
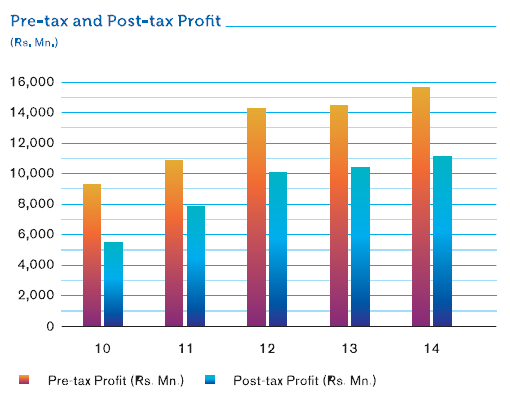
| Pre-VAT,NBT and Income Tax profit | 18,425.2 | 16,479.5 | 1,945.7 | 11.81 |
| Pre-tax profit | 15,736.2 | 14,510.5 | 1,225.7 | 8.45 |
| Post-tax profit | 11,180.2 | 10,445.5 | 734.7 | 7.03 |
Quarterly Profits
Commercial Bank’s quarterly profits recorded satisfactory results throughout 2014, when compared with the corresponding quarters of the previous year. The Bank’s primary sources of income, both fund-based and fee-based, saw good growth. Despite shrinking interest margins in each quarter relative to the previous quarter, the Bank also grew well at the level of net interest income, mainly owing to our judicious fund management strategies. As well, we were able to maintain our cost structure at its optimum level, which supplemented in recording growth in quarterly profits during the year, as shown below:
| 2014 | ||||
| Quarter ended | March 31 | June 30 | September 30 | December 31 |
| Pre-VAT, NBT and Income Tax profit (Rs. Mn.) | 3,896.9 | 3,690.1 | 5,531.7 | 5,306.5 |
| Growth over 2013 (%) | 4.73 | (0.89) | 24.54 | 15.51 |
| Pre-tax profit (Rs. Mn.) | 3,290.6 | 3,183.6 | 4,738.6 | 4,523.4 |
| Growth over 2013 (%) | 1.88 | (2.88) | 21.62 | 10.15 |
| Post-tax profit (Rs. Mn.) | 2,278.7 | 2,200.6 | 3,325.6 | 3,375.3 |
| Growth over 2013 (%) | 1.68 | (1.35) | 20.40 | 5.10 |
Net interest income - the principal source of income from the Bank’s fund-based operations - reached Rs. 27,221.8 Mn. in 2014, an increase of Rs. 1,337.0 Mn. or 5.16%, compared to Rs. 25,884.9 Mn. recorded in 2013. This was a noteworthy achievement, given the substantial reduction in interest spread experienced by the Bank over the course of the year - a decrease of 70 basis points, from 4.23% in 2013 to 3.54% in 2014.
Despite substantial growth in interest-earning assets, the Bank’s interest income declined by Rs. 931.6 Mn. or 1.48% to Rs. 61,832.0 Mn. in 2014, compared to Rs. 62,763.6 Mn. recorded in the previous year. Reflecting the market-wide drop in interest rates, interest expenses also decreased by Rs. 2,268.6 Mn. or 6.15% to Rs. 34,610.2 Mn., compared to Rs. 36,878.8 Mn. in 2013. The main factor driving the downward trend in both interest income and expenses was the timely re-pricing of Bank’s assets and liabilities portfolio several times during the year, as we worked to stay aligned with the general decline in market interest rates.
Analysis of net interest income taking into account changes in average volumes and rates compared to the previous year is summarised below:
| Favourable/(Adverse) Impact toNet Interest Income due to change in | |||
| Average Volumes Rs. Mn. |
Average Rates Rs. Mn. |
Total Rs. Mn. |
|
| Interest income | 17,180.6 | (18,112.2) | (931.6) |
| Interest expenses | (9,819.2) | 12,087.8 | 2,268.6 |
| Net interest income | 7,361.4 | (6,024.4) | 1,337.0 |
Fund-Based Operations
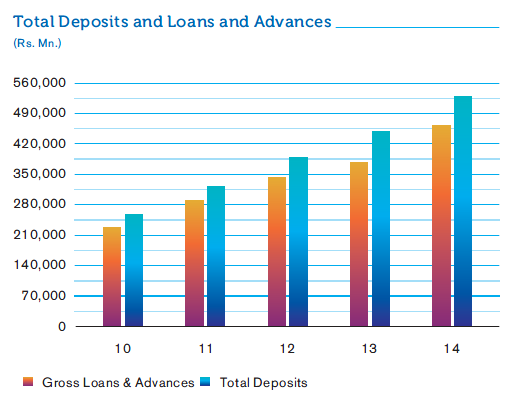
The Bank recorded satisfactory volume growth in both deposits and advances throughout 2014, exceeding the Sri Lankan industry average. Monthly average growth was more than Rs. 6.5 Bn. for deposits and Rs. 7.0 Bn. for loans and advances.
| As at December 31 | Growth Over 2013 | CAGR (5 Years) % |
|||
| 2014 Rs. Mn. |
2013 Rs. Mn. |
Rs. Mn. | % | ||
| Deposits | 529,361.5 | 451,152.9 | 78,208.6 | 17.34 | 17.66 |
| Loans and advances (gross) | 463,586.3 | 379,252.9 | 84,333.4 | 22.24 | 20.98 |
Total Deposits and Loans and Advances
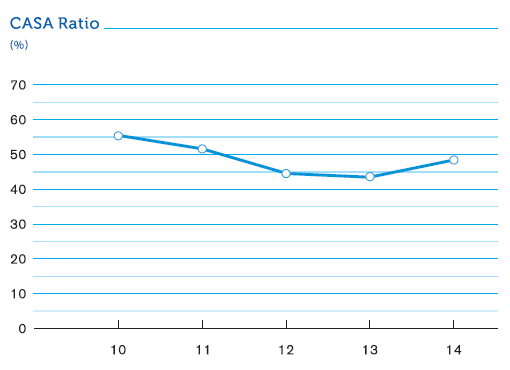
Bank was able to substantially improve the ratio of current and savings accounts (CASA) to total deposits when compared with the ratio reported at the end of 2013. Main contributory factors for this improvement were that there is no incentive for depositors to lock into term deposits due to sharp decline recorded in interest rates as well as initiatives taken by the Bank to mobilise low cost deposits which are discussed in detail under Deposit Mobilisation in this section.
| As at December 31 | ||
| 2014 | 2013 | |
| CASA ratio (%) | 48.38 | 43.51 |
| As at December 31, | Growth Over 2013 | ||||
| 2014 Rs. Mn. |
2013 Rs. Mn. |
Rs. Mn. | % | CAGR (5 Years) % |
|
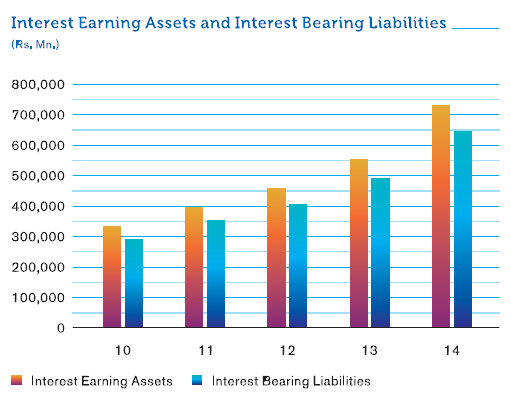
| Interest-earning assets | 734,661.4 | 552,971.4 | 181,690.0 | 32.86 | 20.26 |
| Interest-bearing liabilities | 638.787.0 | 492,694.6 | 146,092.4 | 29.65 | 19.86 |
Interest Earning Assets and Interest Bearing Liabilities
Over the 5-year period, from 2010 to 2014, Commercial Bank has sustained substantial growth in deposits, other interest-bearing liabilities as well as advances and other interest-earning assets.
The Bank’s total assets increased to Rs. 795.6 Bn. at the end of 2014, compared to Rs.606.0 Bn. in 2013. This substantial increase of Rs. 189.6 Bn., or 31.29%, was attributed mainly to growth in loans and advances, as well as in financial assets categorised as available-for-sale. It was funded primarily by increased deposits, as well as by other borrowings during the year.
Fee-Based Operations
In 2014, Commercial Bank recorded a growth of Rs. 581.9 Mn., or 13.69% in net fees and commission income. This was mainly attributable to the substantial increase in fees and commission income from credit/debit cards, trade finance and remittances from overseas customers.
Net Gains/(Losses) from Trading
The Bank recorded a loss of Rs. 305.5 Mn. in trading activities during the year which represents an improvement of Rs. 1,320.4 Mn. compared to the loss of Rs. 1,625.9 Mn. reported in 2013. This was mainly due to the decline in the foreign exchange loss by Rs. 1,157.1 Mn. consequent to a favourable movement in currency premiums during the year.
Net Gains/(Losses) from Financial Investments
Financial investments of the Bank recorded a net gain of Rs. 2,272.6 Mn. which was an improvement of Rs. 923.0 Mn. compared to the gain of Rs. 1,349.5 Mn., recorded in 2013. This growth is mainly attributable to gain on disposal of Government Securities catergorised under available-for-sale as a result of favourable movement in interest rates. However, the above favourable impact was partly set off due to the drop of Rs. 787.3 Mn. in capital gains, which was an one-off disposal of equity shares in 2013.
Other Income (Net)
Other income decreased by Rs. 1,322.5 Mn. or 20.75% year-on-year. This was due to the reduction in net revaluation gain on foreign currency denominated assets and liabilities as a result of the relatively stable exchange rate prevailed throughout the year. Translation gain on account of retained profits from our Off-Shore Banking Centre too dropped compared with 2013. This was due to the lower depreciation of the Sri Lanka Rupee against the US Dollar during the year. The above negative variances were partly set off by the increase in loan recoveries and reversal of provisions as a result of aggressive recovery efforts of the Bank in 2014.
Therefore, non-interest income of the Bank increased to Rs. 11,848.3 Mn. an improvement of 14.53% compared to Rs. 10,345.4 Mn. recorded in 2013. Consequently, the increase of Rs. 2,839.8 Mn. or 7.84%, in the Bank’s total operating income during 2014 could be attributed to growths in both fund-based and fee-based operations.
Impairment Charges on Loans and Advances
With the implementation of SLFRS, the Bank moved from time-based provisioning to the incurred-loss methodology, which consists of two main components: individual impairment and collective impairment. The Bank decides threshold limits for individually significant loans and advances, and loans above these limits are subject to individual impairment. Threshold limits are set to cover a reasonable percentage of the total loan portfolio. Loans and advances above these threshold limits are evaluated against predetermined impairment triggers.
Loans that are not subjected to individual impairment as well as loans which are not individually impaired are categorised into groups based on homogeneous risk characteristics of each product. These loans are then subjected to collective impairment based on the historical loss experience of each product portfolio, expressed in terms of (a) Probability of Default (PD), and (b) Loss Given Default (LGD).
| For the Year Ended December 31, |
Change Over 2013 | |||
| 2014 Rs. Mn. |
2013 Rs. Mn. |
Rs. Mn. | % | |
| Individual impairment | 390.0 | 1,070.2 | (680.2) | (63.56) |
| Collective impairment | 4,462.3 | 4,007.7 | 454.6 | 11.34 |
| Total impairment | 4,852.3 | 5,077.9 | (225.6) | (4.44) |
Individual impairment recorded a substantial decline compared to the last year as a result of provision made on account of a few large non-performing customers in 2013.
Collective impairment recorded a substantial increase mainly due to the increase recorded in the volumes of loans subjected to collective impairment. The Bank’s total impairment charge recorded a drop of 4.44%, mainly because of (a) the decrease in individual impairment, (b) the decline in collective impairment on account of pawning and (c) the general improvement in credit quality.
The impairment charge for 2014 (which includes both capital and interest), compared to the previous time-based loan-loss provisions of the CBSL was as follows:
| For the Year Ended December 31, | ||
| 2014 Rs. Mn. |
2013 Rs. Mn. |
|
| Total impairment charge | 4,852.3 | 5,077.9 |
| Total loan-loss provision (CBSL) | 3,440.4 | 3,765.7 |
| Excess of impairment over loan-loss provision | 1,411.9 | 1,312.2 |
Net operating income after charging the impairment provision amounted to Rs. 34,151.4 Mn., an increase of Rs. 3,125.1 Mn. or 10.07%, compared with Rs. 31,026.3 Mn. in 2013.
Total operating expenses, consisting of personnel, depreciation and amortisation and other operating expenses recorded an increase of Rs. 1,179.4 Mn. or 8.11% compared with 2013. Personnel expenses comprising compensation and benefits paid to employees recorded an increase of 8.76% compared with the last year. Through a continuous rationalisation of the Bank’s cost structure, we were able to contain overhead cost at an optimum level. Even so, depreciation and amortisation saw a substantial increase, mainly because of a change in the rate of depreciation on a class of assets to better reflect the future economic benefits associated with such assets.
As a result of the lower increase recorded in operational expenses, the Bank recorded a notable growth of 11.81% or Rs. 1,945.7 Mn. in operating profit before VAT, NBT and Income Tax up from Rs. 16,479.5 Mn. in 2013.
| For the Year Ended December 31, |
Growth Over 2013 | |||
| 2014 Rs. Mn. |
2013 Rs. Mn. |
Rs. Mn. | % | |
| Pre-VAT, NBT and Income Tax profit | 18,425.2 | 16,479.5 | 1,945.7 | 11.81 |
| Profit before tax | 15,736.2 | 14,510.5 | 1,225.7 | 8.45 |
Financial VAT and NBT on profit showed a substantial increase of 36.57% in 2014, mainly owing to imposition of NBT effective January 1, 2014 and increase in profit. Income tax expenses increased by 12.08% during the year, in line with the increase in profit before VAT and NBT - the baseline for determining the income tax liability.
Other Comprehensive Income (OCI)
In 2014, consequent to a revaluation of all immovable properties of the Bank by qualified valuers in accordance with guidelines issued by the CBSL, the Bank recorded a net revaluation gain of Rs. 1,500.8 Mn. As mentioned under net gains/(losses) from financial investments, we realised part of the mark to market gain on assets held in the available-for-sale category, which resulted in a decline of the unrealised gain recorded under Sri Lankan Government Securities in OCI.
| For the Year Ended December 31, |
Growth Over 2013 | |||
| 2014 Rs. Mn. |
2013 Rs. Mn. |
Rs. Mn. | % | |
| Total comprehensive income | 13,244.2 | 12,233.7 | 1,010.5 | 8.26 |
Total comprehensive income of the Bank , including OCI, amounted to Rs. 13,244.2 Mn., reflecting a growth of Rs. 1,010.5 Mn. or 8.26% over the previous year.
Ratios
Credit Quality Ratios
As discussed under impairment charges in this section, the Bank makes provision for impairment on account of both individual and collective on loans and advances portfolio. Ratios based on impairment are as follows:
| As at December 31, | |||
| 2014 % |
2013 % |
Variance % |
|
| Individual impairment as a % of total loans and advances | 1.03 | 1.11 | (0.08) |
| Collective impairment as a % of total loans and advances | 2.99 | 3.05 | (0.06) |
| Total impairment as a % of total loans and advances | 4.02 | 4.16 | (0.15) |
| Individual impairment as a % of individually-impaired loans and advances | 66.19 | 61.81 | 4.38 |
| Collective impairment as a % of loans and advances subjected to collective impairment | 3.04 | 3.11 | (0.07) |
Impairment in the above table represents cumulative impairment.
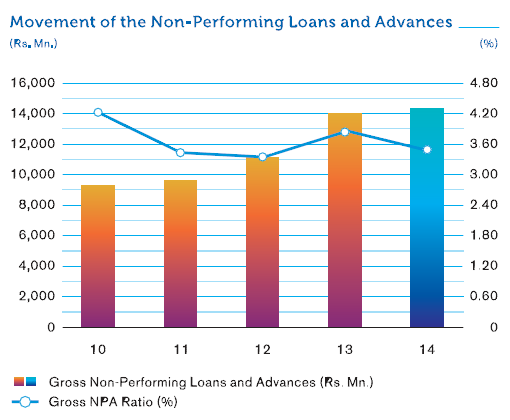
Non-Performing Advances Ratio
The Bank’s core banking system continues to operate under the previous, time-based CBSL provisioning policy, which classifies non-performing advances (NPAs) without any manual intervention. Our provisioning policy is more stringent than the basic requirements stipulated by the CBSL.
In 2014, the Sri Lankan banking industry experienced an increase in NPAs, specially during the first half of the year. This trend gradually reduced towards the end of the year. The Bank was able to curtail the increase in NPAs through proactive approaches adopted by the branches, with support and guidance from the Central Recoveries Department; the latter’s role is discussed in detail towards the end of this Section.
| As at December 31, | ||
| 2014 | 2013 | |
| Gross non-performing loans and advances (Rs. Mn.) | 14,385.7 | 14,040.6 |
| Gross NPA ratio (%) | 3.47 | 3.88 |
| Net NPA ratio (%) | 1.86 | 2.12 |
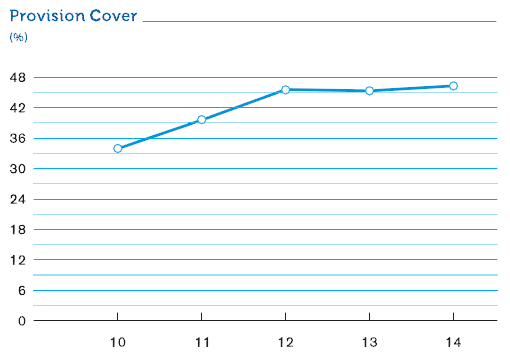
| Provision cover (%) | 46.34 | 45.41 |
| Open credit exposure ratio (%) | 10.69 | 11.69 |
Movement of the Non-Performing Loans and Advances
The Bank is constantly keeping an eye on the provision cover to align with that of well-reputed international banks. Provision cover ratio of 46.34% represents an improvement of 12.29% from 34.05% recorded as at December 31, 2010.
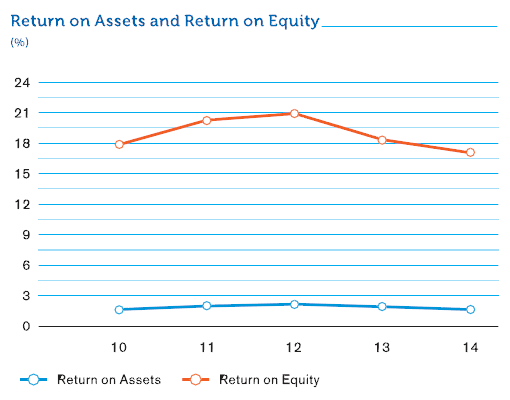
Profitability Ratios: Return on Assets (ROA) and Return on Equity (ROE)
The increase in the Bank’s assets and equity in 2014, at 31.29% and 15.70%, was well above growth in profits, resulting in decreases in ROA and ROE as shown below. However, our ratios remain well above industry averages.
| 2014 % |
2013 % |
|
| ROA (after tax) | 1.60 | 1.87 |
| ROE | 17.01 | 18.40 |
Return on Assets and Return on Equity
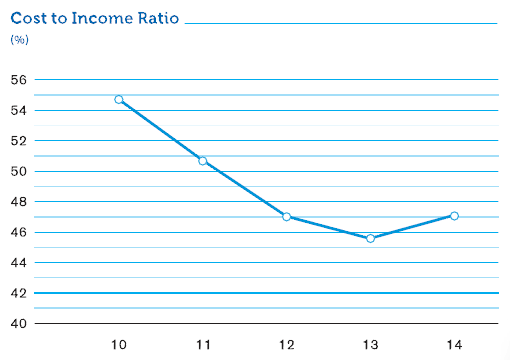
Efficiency Ratios: Cost to Income Ratio
Commercial Bank is recognised as the best private sector bank in Sri Lanka today. One of the main reasons for the Bank’s success has been our sustained and exemplary operational excellence over many years. This has been achieved throughout consistent adoption of optimal and rigorously lean cost structures. Last year, with the increase recorded in operational expenses, the cost to income ratio also increased.
| 2014 | 2013 | |
| Cost to income ratio (%) | 47.13 | 45.59 |
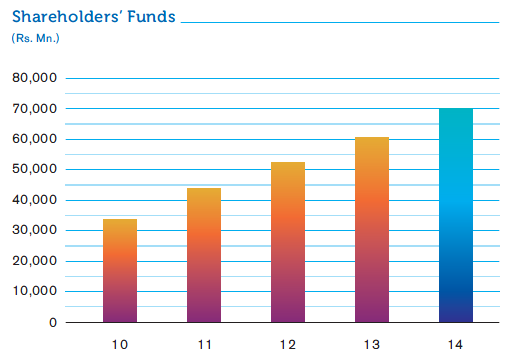
Equity
Shareholders’ equity of the Bank grew by Rs. 9,567.7 Mn., or 15.70%, during the year. Key contributing factors to this increase were (a) the ploughing-back of profits after payment of the Bank’s dividend, and (b) accumulation of Rs. 2/- per share through the issue and allotment of new shares as part of the final dividend of the previous year. In addition, funds transferred to the Investment Fund Account from savings on Income Tax and VAT helped to increase the Bank’s capital base. During the year under review, available funds residing in the Investment Fund Account were transferred to the General Reserves account as advised by the CBSL as the above fund ceased to operate. Total shareholders’ funds stood at Rs. 70,511.7 Mn. as of December 31, 2014.
These developments in the capital base increased the free capital of the Bank to Rs. 58,864.2 Mn. (Rs. 51,755.8 Mn. in 2013). Single-borrower limit too rose to Rs. 19,289.6 Mn. for individual customers and Rs. 21,218.6 Mn. for group of customers - among the highest thresholds in the Sri Lankan banking industry.
Capital Adequacy Ratio
The capital adequacy ratio (CAR) dropped marginally in 2014, mainly because of the increase recorded in the loans and advances portfolio of the Bank. Nevertheless the drop was limited, due to a substantial amount of funds been transferred to Government Securities as a result of lower demand for credit during the year.
| As at December 31 | Statutory Minimum Ratio | ||
| 2014 % |
2013 % |
% | |
| Tier I | 12.93 | 13.27 | 5.00 |
| Tier I & II | 15.97 | 16.91 | 10.00 |
The Bank prepared the Internal Capital Adequacy Assessment Process (ICAAP), a requirement under Pillar 2, the Supervisory Review Process within the Basel II framework, based on figures as of December 31, 2013. The results indicated that the Bank is well within the minimum ratios for the next five years as stipulated under the guidelines of the ICAAP document.
We also assessed liquidity coverage based on the draft guidelines issued by the CBSL - a requirement under Basel III - as of December 31, 2014. Our ratio was well above the minimum requirement applicable as of that date.
Statutory Liquid Assets Ratio
The Bank’s liquid assets ratio was steady around 30% throughout 2014. While our deposit mobilisation efforts generated significant rewards, the banking industry generally did not experience desired levels of credit growth, and as a result, liquidity ratios remained at the same level throughout the year. We are well aware of the trade-off between profitability and liquidity in managing the Bank’s operations.
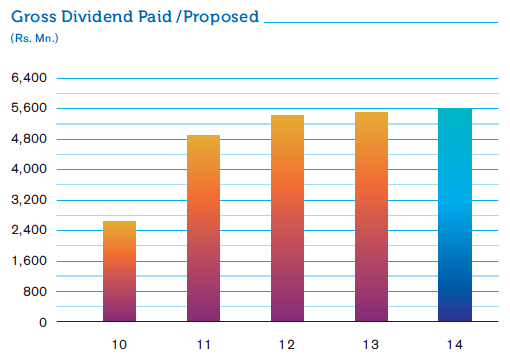
Dividend
The Bank’s dividend policy is designed to address multiple objectives. The main considerations were to maximise the shareholder wealth, increase market capitalisation, ploughing back of additional profits for business expansion and maintaining consistent stream of dividend to shareholders.
The Bank paid two interim dividends totalling to Rs. 2.50 per share to ordinary shareholders for the year ended December 31, 2014. The Board of Directors of the Bank also recommended Rs. 4.00 per share as final dividend for 2014, Rs. 2.00 to be paid in the form of cash and the balance Rs. 2.00 to be satisfied in the form of issue and allotment of shares, similar to the practice adopted in the last few years. Total dividend payment (paid and proposed) for the year amounts to Rs. 5,627.9 Mn. (Rs. 5,522.5 Mn. in 2013) of which Rs. 3,896.0 Mn. paid/to be paid in cash (Rs. 3,822.5 Mn. in 2013) and the balance Rs. 1,731.9 Mn. to be satisfied in the form of issue and allotment of shares (Rs. 1,699.9 Mn. in 2013). Dividend payments in the form of issuing of new shares, would strengthen the capital base of the Bank.
| Per Share | Dividend | |||
| 2014 Rs. |
2013 Rs. |
2014 Rs. Mn. |
2013 Rs. Mn. |
|
| Interim Dividend – Cash | 2.50 | 2.50 | 2,164.1 | 2,122.6 |
| Final Dividend | ||||
| Cash | 2.00 | 2.00 | 1,731.9 | 1,699.9 |
| In the form of issue and allotment of shares | 2.00 | 2.00 | 1,731.9 | 1,699.9 |
| Total | 6.50 | 6.50 | 5,627.9 | 5,522.4 |
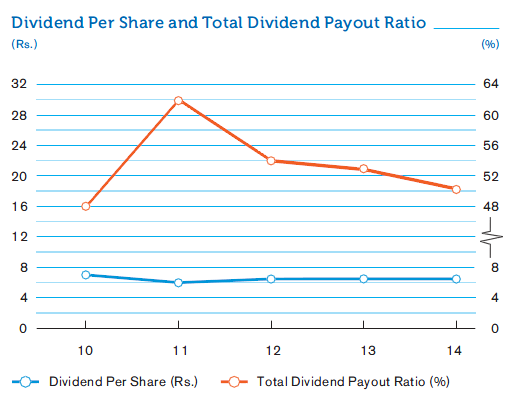
Dividend Per Share and Total Dividend Payout Ratio
The total dividend payout ratio of the Bank was 50.34% compared to 52.87% in 2013. Cash dividend payout ratio was 34.85% compared with 36.60% in 2013.
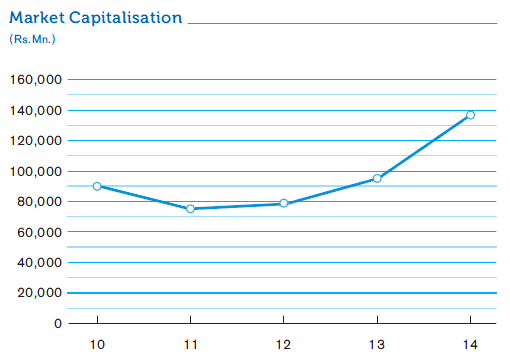
Market Capitalisation
Commercial Bank possesses the best market capitalisation among all listed banking and financial institutions operating in the country today. It ranks number 3 among all listed companies in the Colombo Stock Exchange (CSE). The market capitalisation of the Bank’s shares increased to Rs. 138.6 Bn. as at December 31, 2014 compared to Rs. 95.6 Bn. as at end 2013.
| As at December 31, | ||
| 2014 | 2013 | |
| Market price per share – Voting (Rs.) |
171.00 | 120.40 |
| – Non-Voting (Rs.) | 125.10 | 93.00 |
| Price Earnings ratio (Times) (Voting Shares) |
13.24 | 9.79 |
Group Performance
The Commercial Bank Group, consisting of the Bank and its four subsidiaries – Commercial Development Company PLC (CDC), ONEzero Company Ltd., Commex Sri Lanka S.R.L. – Italy and Indra Finance Ltd. – as well as associated companies Commercial Insurance Brokers (Pvt) Ltd. and Equity Investments Lanka Ltd., recorded satisfactory results in 2014. The operations of these companies are briefly described in the section on ‘Subsidiaries and Associates’ though they are not material in terms of their contribution to the Group’s overall results and financial position. The Group recorded pre and post-tax profits of Rs. 15,859.9 Mn. and Rs. 11,242.8 Mn. respectively, compared to Rs. 14,690.9 Mn. and Rs. 10,573.4 Mn. reported in 2013. Annual growth rates for pre and post-tax profits were 7.96% and 6.33% respectively.
The Bank’s acquisition of Indra Finance Ltd. was completed during the year, guided by the financial sector consolidation road map set out by the CBSL. We are now in the process of strengthening the governance and business practices of the acquired company.
Summary of Income Statement – Bank
| 2014 Rs. Mn. |
2013 Rs. Mn. |
Variance Rs. Mn. |
Main Reason/s | Movement | Amount Rs. Mn. |
|
| Net interest income | 27,221.9 | 25,884.9 | 1,337.0 | Change in average volume | 7,361.4 | |
| Change in average rate | 6,024.4 | |||||
| Non interest income | 11,848.3 | 10,345.4 | 1,502.9 | Sale of Government Securities due to favourable movement in interest rates | 1,652.4 | |
| Drop in revaluation gain on foreign exchange denominated assets and liabilities due to relatively stable exchange rate prevailed in 2014 | 1,672.0 | |||||
| Capital gains from equities in 2013 | 787.4 | |||||
| Net Fees and Commission Income | 581.9 | |||||
| Recoveries of loans written-off/provision reversals | 491.0 | |||||
| Drop in foreign exchange losses from trading activities due to favourable movements in currency premiums | 1,157.1 | |||||
| Total expenses | 15,726.2 | 14,546.8 | 1,179.4 | Personnel expenses | 716.8 | |
| Change in depreciation rate on a class of assets | 210.2 | |||||
| Other operating expenses | 198.2 | |||||
| Impairment charges for loans and other losses | 4,918.8 | 5,204.0 | (285.2) | Provision for individual impairment on behalf of a few large customers in 2013 | 680.0 | |
| Collective impairment due to increase in volumes | 454.5 | |||||
| Tax expenses | 7,245.0 | 6,034.0 | 1,211.0 | Income Tax and VAT on Financial Services due to increase in profit | 829.7 | |
| Introduction of Nation Building Tax | 384.1 | |||||
| Profit after tax | 11,180.2 | 10,445.5 | 734.7 |
Summary of Statement of Financial Position – Bank
| 2014 Rs. Mn. |
2013 Rs. Mn. |
Variance Rs. Mn. |
Main Reason/s | Movement | Amount Rs. Mn. |
|
| Assets | ||||||
| Loans and receivables to other customers | 497,065.8 | 410,951.4 | 86,114.4 | Long term Loans | 48,581.2 | |
| Securities purchased under resale agreements | 32,251.8 | |||||
| Financial investments - Available-for-sale | 214,208.4 | 131,756.5 | 82,451.9 | Investments in Government Securities | 81,798.8 | |
| Total Assets | 795,609.6 | 605,987.6 | 189,622.0 | |||
| Liabilities | ||||||
| Deposits from customers | 529,361.5 | 451,152.9 | 78,208.6 | Savings deposits | 51,567.4 | |
| Time deposits | 21,031.8 | |||||
| Other borrowings | 136,201.0 | 54,173.2 | 82,027.8 | Securities sold under repurchase (Repo) agreements | 85,333.9 | |
| Total Liabilities | 725,097.9 | 545,043.6 | 180,054.3 | |||
| Total Equity | 70,511.7 | 60,944.0 | 9,567.7 | General Reserves | 5,255.0 | |
| Stated Capital | 1,870.7 | |||||
| Revaluation Reserve | 1,500.8 |