Review of the Macroeconomic Environment
Global Economy
Despite some setbacks, the uneven global recovery continues. The growth forecast for the world economy was downgraded to 3.3% for 2014, largely due to weaker-than-expected overall activity in the first half of the year. The global growth projection for 2015 has been lowered to 3.5%.
World Economic Outlook
| Projections | ||||
| 2013 % |
2014 % |
2015 % |
2016 % |
|
| World Output | 3.3 | 3.3 | 3.5 | 3.7 |
| Advanced Economies | 1.3 | 1.8 | 2.4 | 2.4 |
| United States | 2.2 | 2.4 | 3.6 | 3.3 |
| Euro Area | -0.5 | 0.8 | 1.2 | 1.4 |
| Japan | 1.6 | 0.1 | 0.6 | 0.8 |
| United Kingdom | 1.7 | 2.6 | 2.7 | 2.4 |
| Emerging and Developing Asia | 6.6 | 6.5 | 6.4 | 6.2 |
| Russia | 1.3 | 0.6 | -3.0 | -1.0 |
| China | 7.8 | 7.4 | 6.8 | 6.3 |
| India | 5.0 | 5.8 | 6.3 | 6.5 |
| ASEAN-5 | 5.2 | 4.5 | 5.2 | 5.3 |
Source: IMF World Economic Outlook Update – January 2015
In advanced economies, the legacies of the pre-crisis boom and the subsequent crisis (including the lingering impact of high private and public debt) continue to cast a shadow on the recovery. Emerging markets are adjusting to rates of economic growth lower than those reached in the pre-crisis and immediate post-crisis periods. Overall, the pace of recovery varies from country to country.
Financial markets have been buoyant, with high equity prices, compressed spreads and very low volatility. However, this situation has not translated into a rise in investment, which - particularly in advanced economies - has remained subdued.
Advanced Economies
Growth is expected to strengthen in 2014-15 across most advanced economies, but once again the pace of recovery will vary across regions. The US is expected to enjoy the strongest rebound in growth, while the post-crisis brakes will ease more slowly in the Euro Area and Japan will continue to grow modestly.
Emerging Markets and Developing Economies
Growth in emerging markets and developing economies was projected to increase modestly through the second half of 2014 and into 2015, supported by stronger domestic demand, as well as a recovery in external demand fuelled by faster growth in advanced economies.
Asian Economies
In China, growth projections have been revised downward slightly for both 2014 and 2015 after first-quarter output was weaker than expected. Chinese authorities deployed policy measures to bolster economic activity. For 2015, the growth rate will likely moderate to 6.4% as the economy moves to a more sustainable path and residential investment slows further.
In India, growth was expected to increase through the end of 2014 and into 2015 as exports and investment continue to pick up, offsetting the damaging effect on agricultural growth of a monsoon earlier in the year.
The Global Banking Sector
As unlikely as it may seem for an industry that has posted a 70% growth in net income since 2009 - along with strong growth in Return on Equity (ROE) - banks faced major challenges as they headed into 2014. There is no question, the industry has rebounded from the crippling credit crisis of five years ago, when bank failures surged, balance sheets became bloated with bad loans and industry ROE was in the negative at 3.7%. Since that time, banks have slashed payrolls, shed non-core businesses and written-off trillions of Dollars in bad assets.
Still, the earnings improvements of the past several years can be largely attributed to rapidly declining provisions for loan losses and aggressive cost cutting. Today, while problem loans continue to decline, the impact of shrinking loan-loss reserves on the bottom line is diminishing. Given the trend now evident in the credit cycle, this issue could be exacerbated as lending gradually ticks upward, possibly leading to higher credit losses. More aggressive lending, fuelled by competition among financial institutions, could tempt some banks to lower credit standards; this in turn could potentially lead to higher credit costs and even more scrutiny from regulators concerned about deteriorating underwriting standards.
The mergers and acquisitions ‘wave’ that was widely expected to sweep through the global banking industry over the past several years has amounted to little more than a ripple. There were 162 bank mergers in the US through the first three quarters of 2013, up from 111 in the equivalent period two years earlier. Still, mergers, joint ventures and strategic acquisitions remain a powerful tool for growth.
Some institutions may find that the only way to meet these imperatives is through mergers, acquisitions or joint ventures. Whatever course individual banks may choose to pursue, the way forward will not be easy and in many cases will require a paradigm shift in business culture and yet the alternative is even less palatable: a gradual slide into irrelevance, with lingering regret over an opportunity missed.
Therefore, transformation is inevitable - and the time to begin is now.
(Banking Outlook 2014: An Industry at a Pivot Point - KPMG)
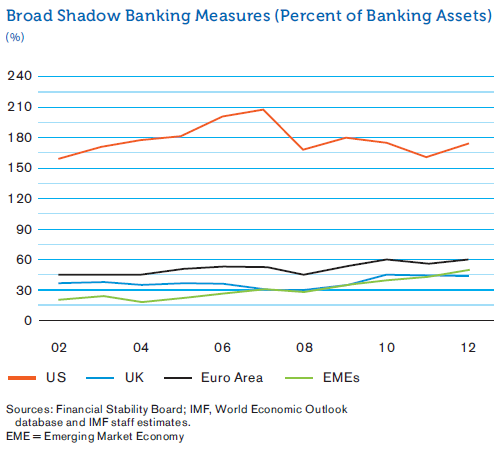
Shadow Banking
The shadow banking system - consisting of financial intermediaries that facilitate the creation of credit across the global financial system without being subject to regulatory oversight - constitutes about one-fourth of all intermediation worldwide. The US, the Euro Area and the UK have the world’s largest shadow banking systems, according to Financial Stability Board (FSB) data.
Broad Shadow Banking Measures
Broad Shadow Banking Measures (Percent of Banking Assets)
Since the crisis, global regulatory reforms co-ordinated by the FSB have called for greater disclosure of asset valuations, improved governance, ownership reforms, and stricter oversight and regulation of shadow banks. There are concerns that the ongoing tightening of bank regulations may be encouraging a shift of traditional banking activities into the shadows.
(Global Financial Stability Report, October 2014, IMF)
Penalties Imposed on US and UK Banks for Irregularities
Fines and settlements paid to US federal and state authorities cost banks more than US $40 Bn. in 2014, according to Reuters estimates. At the same time, European authorities handed out record fines of more than US $3 Bn. Two trends are clear: authorities are imposing larger fines on banks in an effort to clean up standards; and regulators appear to be working more effectively with one another as they all strive to share in any material penalties.
As 2015 gets underway, banks in the US still face scrutiny over a long list of issues and when the European Commission imposed a new interest rate settlement, it vowed to keep probing the rate-rigging issue. Nearly three-quarters of the penalties stemmed from investigations conducted in conjunction with overseas regulators, mainly in the US, who also imposed hefty penalties.
(Sources: Reuters)
Developments in the Implementation of Basel lll
By the end of 2013, all members of the Basel Committee on Banking Supervision had implemented Basel III risk-based capital regulations. Efforts are now underway to adopt Basel III standards for liquidity and leverage ratios, as well as for global systemically important banks (G-SIBs) and domestic systemically important banks (D-SIBs). As of September 2014, final or draft rules had been issued by 26 members on the liquidity coverage ratio (LCR), by 23 members on the leverage ratio and by 23 members on G-SIB or D-SIB frameworks.
With regard to ongoing implementation efforts, the Committee will continue to emphasise consistency of practices and the rigorous analysis of outcomes to promote financial stability and a level playing field. The key elements of the Committee’s implementation strategy for 2014-2016 will be to strengthen monitoring mechanisms while continuing the semi-annual assessment of Banks’ progress in meeting the Basel III requirements. The Committee also plans to complete the first round of jurisdictional assessments of Basel III capital standards by 2016, and to begin assessment of LCR and G-SIB and D-SIB standards from 2015 onwards.
Once fully-implemented, the Basel III framework is expected to improve banks’ resilience to asset and liquidity stresses and shocks. Having said that, it is too soon to conclude that the industry has achieved stronger creditworthiness. Globally, banks have made substantial improvements in their fundamentals, including reductions in leverage, implementing firm-wide stress testing, and forming more robust liquidity and funding profiles. Nevertheless, many banks remain challenged in meeting full Basel III requirements while at the same time sustaining profitable business models under more stringent regulatory constraints.
(Moody’s global review of Basel III implementation highlights progress made and jurisdictional differences, August 3, 2014 Moody’s Investors Service)
Local Economy
The Sri Lankan economy has grown at an annual average rate of 7.5% over the past three years. This upward trend is expected to continue, with the services sector as the key driver of GDP growth spurred by export trade and the hotels and other tourism related activities. The ongoing boom in the tourism industry could also result in spin-off benefits to Sri Lanka’s construction industry. Construction activity, which represents 10% of GDP, is also buoyant, supported by continued foreign direct investment (FDI).
Sector Contribution to GDP
| Contribution to GDP Growth (%) | Share of GDP (%) | |||
| Sector | 1H 2013 | 1H 2014 | 1H 2013 | 1H 2014 |
| Agriculture | 1.9 | 4.6 | 11.6 | 11.1 |
| Industry | 48.3 | 49.5 | 30.7 | 32.1 |
| Services | 49.8 | 45.9 | 57.7 | 56.8 |
The revival in global demand in 2014 supported growth in these sectors and looking ahead, enhanced growth prospects in the US economy could boost the Sri Lankan manufacturing sector over the next few years.
Loan growth, excluding personal loans, is showing signs of improvement, and capital markets activity is on the rise. Sri Lanka has seen two US Dollar-denominated corporate bond issues in 2014. Equity-market capitalisation has increased, with at least five new listings in 2014. Turnover value on the Colombo Stock Exchange almost doubled compared to the previous year.
While rapid economic growth has helped Sri Lanka’s Government to reduce the fiscal deficit (as a percentage of GDP) since the end of the civil disturbances in 2009, the public debt burden remains high.
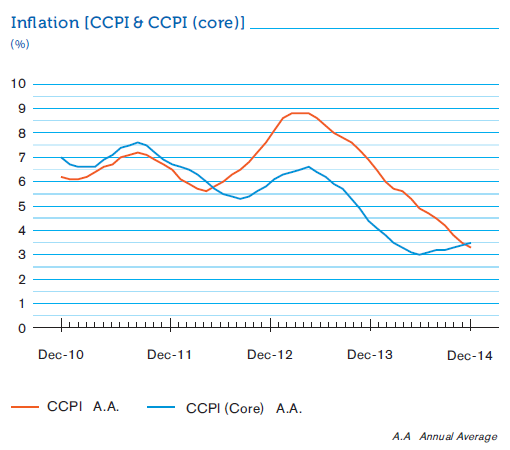
Inflation
Sri Lanka recorded a single-digit inflation rate for 71 consecutive months as of December 2014. Inflation, as measured by the change in the Colombo Consumers’ Price Index (CCPI), was 2.1% on a YoY basis in December 2014. The single-digit inflation rate was largely supported by a sharp reduction in energy prices and lower prices of some key commodities in the international market.
The direct and indirect impact of the recent reduction in the prices of essential items by the Government, lower commodity prices in the international market and also the impact of lower utility costs are likely to reduce inflationary pressures over the short term.
Inflation [CCPI & CCPI (core)](%)
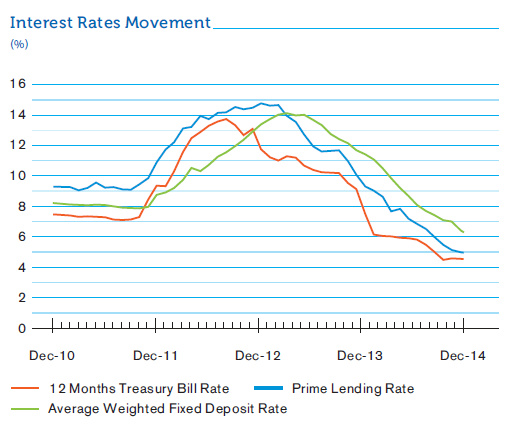
Interest Rates
Interest rates in Sri Lanka declined during 2014. This trend was helped by the monetary policy measures adopted by the CBSL, which were designed to enhance credit growth and drive the GDP. Over the past year, the interest rates on Government Securities declined significantly in comparison to the interest rates on loans and deposits offered by commercial banks.
Credit to the Private Sector
The banking sector’s YoY growth in credit provided to the private sector declined up to July 2014. The main reasons for this include a drop in pawning advances, falling credit demand from the private sector, the repayment of high interest loans with new loans obtained at lower rates and borrowing by private sector organisations from foreign sources and through corporate bond issues.
However, the private sector credit growth started to pick up from August 2014 onwards due to further relaxation of the monetary policy, introduction of a Credit Guarantee Scheme on Pawning Advances in June 2014 and the increase in the general income level of the people etc.
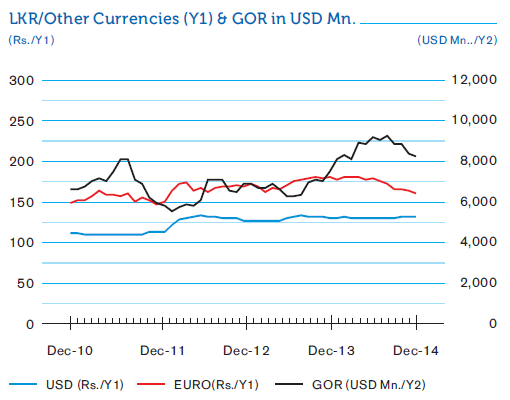
External Sector
A strong recovery in exports in the second half of 2013 which continued into 2014, combined with declining imports and continued inflow of remittances and services receipts, bolstered Sri Lanka’s balance of payments in the past year. This trend, together with issuance of external debt, enabled the CBSL to accumulate international reserves.
International Reserve Position
A reduction in the current account deficit, coupled with global bond issuances, helped to replenish Sri Lanka’s foreign exchange reserves. Now the build-up in official international reserves is reducing the nation’s near-term vulnerability to external financial shocks.
Sri Lanka’s Gross Official Reserves remained high at US $ 8.8 Bn. as of September 2014, which was equivalent to 5.6 months of imports.
Exchange Rates and Gross Official Reserves (GOR)
LKR/Other Currencies (Y1) & GOR in USD Mn.
The domestic foreign exchange market remained relatively stable in 2014. The Sri Lankan Rupee held its value against the US Dollar with a marginal depreciation. Based on cross-currency exchange rate movements, the Rupee appreciated against the Euro, the Japanese Yen and the UK Sterling Pound.
The Share Market
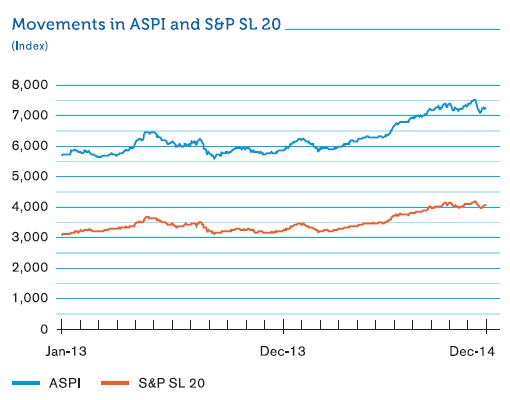
The Colombo Stock Exchange recorded a stellar performance in 2014, surpassing several previous records.
In 2014, the Standard & Poor’s Sri Lanka 20 (S&P SL 20) Index crossed the 4,000 mark for the first time since its launch. Total market capitalisation surpassed Rs. 3.0 Tn. mark, closing the year at Rs. 3.105 Tn. The All Share Price Index (ASPI) crossed the 7,500 mark and closed the year at 7,299.
Sri Lanka’s stock market also did well compared to global markets. It is one of the six best-performing markets internationally and one of the five best-performing markets in the region, with the ASPI showing a year-to-date growth of 23.4% as of December 31, 2014.
Movements in ASPI and S&P SL 20
Key Economic Indicators and their Impact to Commercial Bank
| Economic Indicator | Movement During 2014 | Cause for Movement | Impact on Commercial Bank |
| The world economy (World output) | The world economy is estimated to have recorded a growth of 3.3% in 2014 (3.3% in 2013). | Sri Lanka’s major export destinations such as US, UK and Euro area are estimated to have recorded better economic growth rates in 2014. | Helped the Bank to record substantial growth in loans and advances. |
| Local economy (GDP) | The Sri Lankan economy is estimated to have recorded a growth of 7.8% in 2014. | Significant growth recorded in services and industrial sector. | Helped the Bank to increase in business volumes substantially. |
| Inflation andinterest rates | Inflation was maintained mostly at lower single digit levels and a decline in market interest rates. | Lower rate of inflation contributed to a decline in market interest rates. | Helped the Bank to record substantial growth in loans and advances. |
| Exchange rate (LKR/USD) | The LKR/USD exchange rate moved within a range of Rs. 130 – 132 | The Rupee appreciated gradually up to October amidst steady foreign exchange inflows. Thereafter, it depreciated slightly with increased demand for foreign exchange particularly due to higher import demand. | Resulted in reducing the exchange profit of the Bank. |
| Credit to the private sector by banks | Increase in private sector credit by banks during the latter part of the year. | Low private sector credit by banks during the first half and that trend was reversed during the second half of the year due to an improvement in business sentiments supported by appropriate monetary policy. | Helped the Bank to record substantial growth in loans and advances during the second half of the year. |
Banking Industry
One of the key developments which took place during the year was the implementation of 1st phase of the financial sector consolidation plan proposed by the Central Bank. Under this plan, quite a number of acquisitions and mergers took place in the industry among both Banks and Non-Banking Institutions.
In addition to the above, the following major activities within the sector were witnessed during the year.
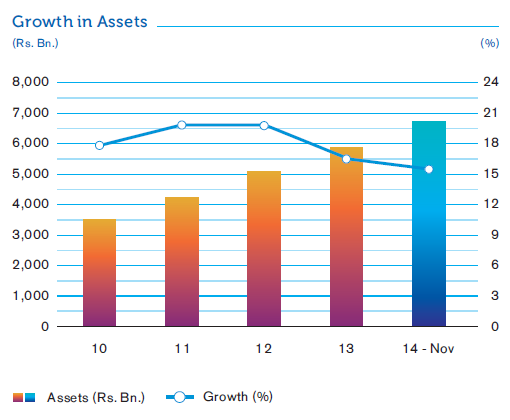
Total Assets
The growth of total assets in the banking sector moderated during the first eleven months of 2014, owing to moderation in credit growth. The liquidity position of banks remained healthy. Although profits of the banking sector increased, but profitability decreased marginally.
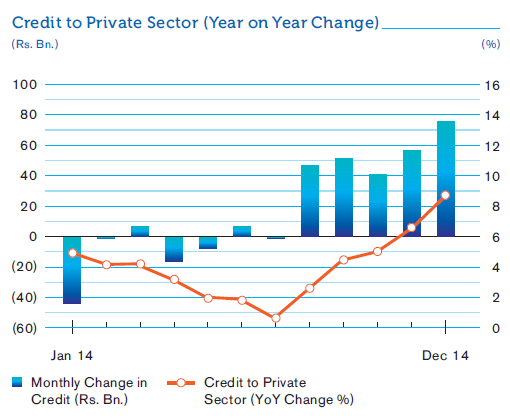
Credit to Private Sector (Year on Year Change)
Credit to Private Sector
In December 2014, credit extended to the private sector by commercial banks grew by 8.8% on a YoY basis, maintaining its upward trend since August 2014. In absolute terms, credit obtained by the private sector recorded a historic high of Rs. 76.5 Bn. during the month of December, resulting in a cumulative increase in private sector credit of Rs. 223.9 Bn. during 2014. The sector-wise classification of credit growth indicates increased credit disbursements to the industrial and services sectors in the latter half of 2014.
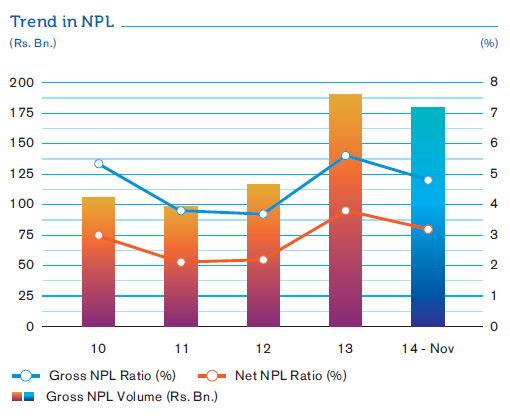
Non-Performing Advances
The overall level of non-performing loans (NPLs) at financial institutions decreased in 2014. This was largely due to a decline in NPLs connected to pawning advances during the year, as well as the efforts of financial institutions to adopt appropriate measures for improving asset quality. Except for pawning, all other major loan products had reported an increase in NPLs during first 11 months of 2014.
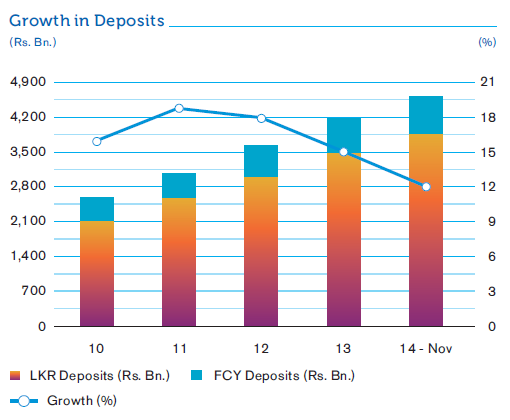
Deposits
The CASA (current and savings account) ratio increased from 34.4% in December 2013 to 38.0% by November 2014. 63.0% of the increase was due to increase in Savings deposits.
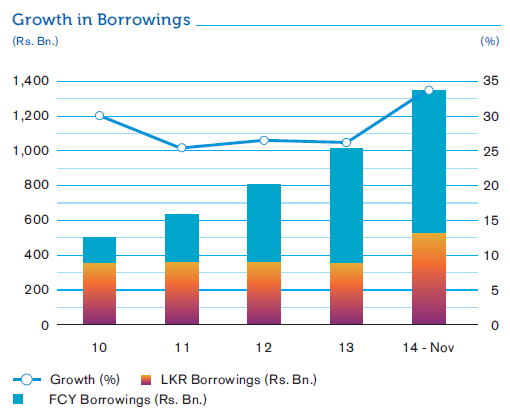
Borrowing
As at end November 2014, foreign currency borrowings in Sri Lanka represented 60% of total borrowings, of which 94.5% was borrowed from foreign sources.
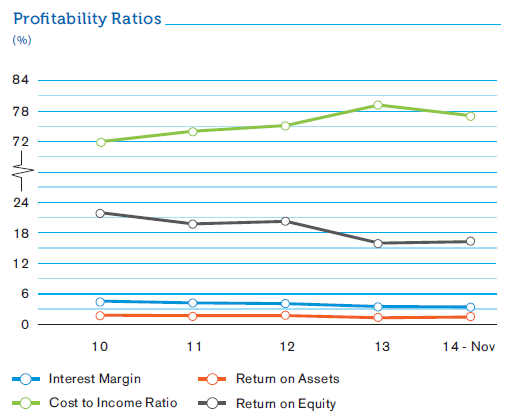
Profitability and Efficiency
Profits in Sri Lanka’s banking sector improved in 2014, in comparison to the previous year for several reasons:
- An increase in net interest income due to delayed effect of rate reductions.
- Gains on investments in securities with declining yields.
- A lower level of provisions required during 2014 compared to 2013.
- An improvement in efficiency levels due to continued drop in staff expenses in proportion to total operating cost while increasing the total income.
New Banking-Related Legislation/Policies Adopted in 2014
| Further strengthened capital planning and risk management |
|
| Enhanced risk management standards of banks |
|
| Focus on Information Security Management |
|
| Implementation of Financial Sector Consolidation plan |
|
| Application of new accounting standards effective from January 01, 2014 |
|