Notes to the Financial Statements
1. Reporting Entity
1.1 Corporate Information
Commercial Bank of Ceylon PLC (the ‘Bank’) is a public limited liability company listed on the Colombo Stock Exchange, incorporated on June 25, 1969 under the Companies Ordinance No. 51 of 1938, (and domiciled) in Sri Lanka. It is a licensed commercial bank regulated under the Banking Act No. 30 of 1988 and amendments thereto. The Bank was re-registered under the Companies Act No. 07 of 2007 on January 23, 2008, under the Company Registration No. PQ 116. The registered office of the Bank is situated at ‘Commercial House’, No. 21, Sir Razik Fareed Mawatha, Colombo 01, Sri Lanka. The ordinary shares of the Bank have a primary listing on the Colombo Stock Exchange.
The staff strength of the Bank as at December 31, 2014 was 4,852 (4,730 as at December 31, 2013).
For further information please refer the inner back cover of this Annual Report.
1.2 Consolidated Financial Statements
The Consolidated Financial Statements as at and for the year ended December 31, 2014, comprise the Bank (Parent Company) and its Subsidiaries (together referred to as the ‘Group’ and individually as ‘Group entities’), and the Group’s interest in its Associates.
The Bank does not have an identifiable Parent of its own. The Bank is the ultimate parent of the Group.
1.3 Principal Business Activities, Nature of Operations and Ownership by the Bank in its Subsidiaries and Associates
| Entity | Principal Business Activities | Ownership at December 31, 2014 |
Ownership at December 31, 2013 |
| Bank | Providing a comprehensive range of financial services encompassing accepting deposits, personal banking, trade financing, off-shore banking, resident and non-resident foreign currency operations, travel-related services, corporate and retail credit, syndicated financing, project financing, development banking, lease financing, hire purchase financing, rural credit, issuing of local and international debit and credit cards, tele-banking facilities, internet banking, mobile banking, money remittance facilities, dealing in Government Securities and treasury-related products, salary remittance package, bullion trading, export and domestic factoring, pawning, margin trading, e-Banking services, Bancassurance and Islamic banking products and services, etc. | N/A | N/A |
| Subsidiaries | |||
| Commercial Development Company PLC | Property development & related ancillary services and outsourcing of staff for non-critical functions of the Bank. |
94.55% | 94.55% |
| ONEzero Company Ltd. | Providing IT-related services. | 100.00% | 100.00% |
| Commex Sri Lanka S.R.L. | Acting as an agent to the Bank and providing money transfer services, opening accounts, issuance and encashment of foreign currencies and travellers’ cheques and collecting applications for credit facilities. The commercial operations of this company are yet to be commenced. | 100.00% | 100.00% |
| Indra Finance Ltd. | Providing financial services including leasing, hire purchase, loans, etc. | 100.00% | N/A |
| Associates | |||
| Equity Investments Lanka Ltd. | Fund management | 22.92% | 22.92% |
| Commercial Insurance Brokers (Pvt) Ltd. | Insurance brokering | 18.91% | 18.91% |
(*) As per the Financial Sector Consolidation Road Map of the Central Bank of Sri Lanka, the Bank acquired 100% stake in Indra Finance Ltd. on September 01, 2014.
(**) 20% stake of Commercial Insurance Brokers (Pvt) Ltd. is held by Commercial Development Company PLC, a 94.55% owned subsidiary of the Bank, which is listed on the Colombo Stock Exchange. The Bank has a significant influence over financial and operating activities of Commercial Insurance Brokers (Pvt) Ltd. though it effectively holds only 18.91%.
There were no significant changes in the nature of the principal business activities of the Bank and the Group during the financial year under review.
2. Basis of Preparation
2.1 Statement of Compliance
The Consolidated Financial Statements of the Group and the separate Financial Statements of the Bank, have been prepared and presented in accordance with the Sri Lanka Accounting Standards (SLFRSs) laid down by The Institute of Chartered Accountants of Sri Lanka and in compliance with the requirements of the Companies Act No. 07 of 2007 and the Banking Act No. 30 of 1988 and amendments thereto and provide appropriate disclosures as required by the Listing Rules of the Colombo Stock Exchange. These Financial Statements, except for information on cash flows have been prepared following the accrual basis of accounting.
These SLFRSs are available at www.casrilanka.com.
The Group did not adopt any inappropriate accounting treatments which are not in compliance with the requirements of the SLFRSs and regulations governing the preparation and presentation of the Financial Statements.
Details of the Group’s Significant Accounting Policies followed during the year are given in Notes 5 to 8 on this page.
The formats used in the preparation of the Financial Statements and the disclosures made therein also comply with the specified formats prescribed by the Central Bank of Sri Lanka for the preparation, presentation and publication of Annual Audited Financial Statements of Licensed Commercial Banks.
2.2 Responsibility for Financial Statements
The Board of Directors of the Bank is responsible for the preparation and presentation of the Financial Statements of the Group and the Bank as per the provisions of the Companies Act No. 07 of 2007 and SLFRSs.
The Board of Directors acknowledges their responsibility for Financial Statements as set out in the ‘Annual Report of the Board of Directors’, ‘Statement of Directors’ Responsibility’ and the certification on the Statement of Financial Position in Stewardship and Financial Reports sections.
These Financial Statements include the following components:
- an Income Statement and a Statement of Profit or Loss and Other Comprehensive Income providing the information on the financial performance of the Group and the Bank for the year under review. Refer Financial Reports section;
- a Statement of Financial Position providing the information on the financial position of the Group and the Bank as at the year-end. Refer Financial Reports section;
- a Statement of Changes in Equity depicting all changes in shareholders’ funds during the year under review of the Group and the Bank. Refer Financial Reports section.
- a Statement of Cash Flows providing the information to the users, on the ability of the Group and the Bank to generate cash and cash equivalents and the needs of entities to utilise those cash flows. Refer Financial Reports section.
- Notes to the Financial Statements comprising Accounting Policies and other explanatory information. Refer Financial Reports section.
2.3 Approval of Financial Statements by the Board of Directors
The Financial Statements of the Group and the Bank for the year ended December 31, 2014 (including comparatives for 2013) were approved and authorised for issue by the Board of Directors in accordance with Resolution of the Directors on February 23, 2015.
2.4 Basis of Measurement
The Financial Statements of the Group have been prepared on the historical cost basis except for the following material items stated in the Statement of Financial Position.
| Items | Basis of Measurement | Note No./s |
| Held for trading financial instruments including financial derivatives |
Fair Value | 29 & 30 |
| Financial investments -available-for-sale | Fair Value | 33 |
| Land & buildings | Measured at cost at the time of acquisition and subsequently at revalued amounts which are the fair values at the date of revaluation | 36 |
| Defined benefit obligation | Liability for defined benefit obligations is recognised as the present value of the defined benefit obligation less the net total of the plan assets, plus unrecognised actuarial gains, less unrecognised past service cost and unrecognised actuarial losses | 47.1, 47.2 & 47.4 |
2.5 Functional and Presentation Currency
Items included in the Financial Statements of the Group are measured using the currency of the primary economic environment in which the Bank operates (the Functional Currency).
Each entity in the Group determines its own functional currency and items included in the Financial Statements of these entities are measured using that Functional Currency. There was no change in the Group’s Presentation and Functional Currency during the year under review.
These Financial Statements are presented in Sri Lankan Rupees, the Group’s Functional and Presentation Currency.
The information presented in US Dollars in the Section on ‘Supplementary Information’ does not form part of the Financial Statements and is made available solely for the information of stakeholders.
2.6 Presentation of Financial Statements
The assets and liabilities of the Group presented in the Statement of Financial Position are grouped by nature and listed in an order that reflects their relative liquidity and maturity pattern.
No adjustments have been made for inflationary factors affecting the Financial Statements.
An analysis on recovery or settlement within 12 months from the Reporting date and after more than 12 months from the Reporting date is presented on this page.
Financial assets and financial liabilities are offset and the net amount reported in the Statement of Financial Position only when there is a legally enforceable right to offset the recognised amounts and there is an intention to settle on a net basis, or to realise the assets and settle the liabilities simultaneously. Income and expenses are not offset in the Income Statement unless required or permitted by an Accounting Standard or interpretation and as specifically disclosed in the Accounting Policies of the Bank.
2.7 Materiality and Aggregation
Each material class of similar items is presented separately in the Financial Statements. Items of dissimilar nature or function are presented separately unless they are immaterial as permitted by the Sri Lanka Accounting Standard - LKAS 1 on ‘Presentation of Financial Statements’.
2.8 Rounding
The amounts in the Financial Statements have been rounded-off to the nearest Rupees thousands, except where otherwise indicated as permitted by the Sri Lanka Accounting Standard - LKAS 1 on ‘Presentation of Financial Statements’.
2.9 Comparative Information
Comparative information including quantitative, narrative and descriptive information is disclosed in respect of the previous period for all amounts reported in the Financial Statements in order to enhance the understanding of the current period’s Financial Statements and to enhance the inter-period comparability. The presentation and classification of the Financial Statements of the previous year is amended, where relevant for better presentation and to be comparable with those of the current year.
2.10 Use of Judgements and Estimates
In preparing the Financial Statements of the Group in conformity with SLFRSs, the Management has made judgements, estimates and assumptions that affect the application of Accounting Policies and the reported amounts of assets, liabilities, income and expenses. Actual results may differ from these estimates. Estimates and underlying assumptions are reviewed on an ongoing basis. Revisions to accounting estimates are recognised prospectively.
The most significant areas of estimation uncertainty and critical judgements in applying Accounting Policies that have most significant effect on the amounts recognised in the Financial Statements of the Group are as follows:
2.10.1 Going Concern
The Management has made an assessment of its ability to continue as a going concern and is satisfied that it has the resources to continue in business for the foreseeable future. Furthermore, the Management is not aware of any material uncertainties that may cast significant doubt upon the Group’s ability to continue as a going concern. Therefore, the Financial Statements of the Group continue to be prepared on a going concern basis.
2.10.2 Fair Value of Financial Instruments
The determination of fair values of financial assets and financial liabilities recorded on the Statement of Financial Position for which there is no observable market price are determined using a variety of valuation techniques that include the use of mathematical models. The Group measures fair value using the fair value hierarchy that reflects the significance of input used in making measurements. Methodologies used for valuation of financial instruments and fair value hierarchy are stated in Note 4 on this page.
2.10.3 Financial Assets and Liabilities Classification
The Significant Accounting Policies of the Group provide scope for assets and liabilities to be classified at inception into different accounting categories in certain circumstances.
- In classifying financial assets or liabilities at ‘Fair value through profit or loss’, the Group has determined that it has met the criteria for this designation set out in Notes 5.3.3.1 and 5.3.4.1 given below.
- In classifying financial assets as ‘Held to maturity’, the Group has determined that it has both the positive intention and ability to hold the assets until their maturity date as required by Note 5.3.3.5 given below.
2.10.4 Impairment Losses on Loans and Receivables
The Group reviews its individually significant loans and advances at each Reporting date to assess whether an impairment loss should be provided for in the Income Statement. In particular, Management’s judgement is required in the estimation of the amount and timing of future cash flows when determining the impairment loss.
These estimates are based on assumptions about a number of factors and hence actual results may differ, resulting in future changes to the provisions made.
The individual component of the total provision for impairment applies to financial assets evaluated individually for impairment and is based on Management’s best estimate of the present value of the cash flows that are expected to be received. In estimating these cash flows, Management makes judgements about a borrower’s financial situation and the net realisable value of any underlying collateral. Each impaired asset is assessed on its merits, and the workout strategy and estimate of cash flows considered recoverable.
A collective component of the total provision is established for:
- groups of homogeneous loans and advances that are not considered individually significant; and
- groups of assets that are individually significant but that were not found to be individually impaired
The collective provision for groups of homogeneous loans is established using statistical methods (such as, net flow rate methodology, risk migration analysis) or, a formula approach based on historical loss rate experience, using the statistical analysis of historical data on delinquency to estimate the amount of loss. Management applies judgement to ensure that the estimate of loss arrived at on the basis of historical information is appropriately adjusted to reflect the economic conditions and product mix at the Reporting date. The loss rates are regularly benchmarked against actual loss experience.
In assessing the need for collective loss allowance, Management considers factors such as credit quality (for example, loan to collateral ratio, level of restructured performing loans) portfolio size, concentrations and economic factors. To estimate the required allowance, assumptions are made to define how inherent losses are modelled and to determine the required input parameters, based on historical experience and current economic conditions (including policy rates, inflation, growth in Gross Domestic Product, sovereign rating, etc).
The accuracy of the provision depends on the model assumptions and parameters used in determining the collective provision.
Refer Note 5.3.10.1 for details.
2.10.5 Impairment of Financial Investments – Available-for-Sale
The Group reviews the debt securities classified as available-for-sale investments at each Reporting date to assess whether they are impaired. This requires similar judgements as applied on the individual assessment of loans and advances.
The Group also records impairment charges on available-for-sale equity investments when there has been a significant or prolonged decline in the fair value below their cost along with the historical share price movements, duration and extent up to which the fair value of an investment is less than its cost.
Refer Note 5.3.10.2 for details.
2.10.6 Impairment Losses on Non-Financial Assets
The Group assesses whether there are any indicators of impairment for an asset or a Cash-Generating Unit (CGU) at each Reporting date or more frequently, if events or changes in circumstances necessitate to do so. This requires the estimation of the ‘Value in use’ of such individual assets or the CGUs. Estimating ‘Value in use’ requires the Management to make an estimate of the expected future cash flows from the asset or the CGU and also to select a suitable discount rate in order to calculate the present value of the relevant cash flows. This valuation requires the Group to make estimates about expected future cash flows and discount rates and hence, they are subject to uncertainty.
Refer Note 5.8 for details.
2.10.7 Revaluation of Property, Plant & Equipment
The Group measures land and buildings at revalued amounts with changes in fair value being recognised in Equity through Other Comprehensive Income (OCI). The Group engaged independent professional valuers to assess fair value of land and buildings as at December 31, 2014. The key assumptions used to determine the fair value of the land and building and sensitivity analyses are provided in Note 36.5 (b) on this page.
2.10.8 Useful Life-time of the Property, Plant & Equipment
The Group reviews the residual values, useful lives and methods of depreciation of Property, Plant & Equipment at each Reporting date. Judgement of the Management is exercised in the estimation of these values, rates, methods and hence they are subject to uncertainty.
2.10.9 Deferred Tax Assets
Deferred tax assets are recognised in respect of tax losses to the extent that it is probable that future taxable profit will be available against which such tax losses can be utilised. Judgement is required to determine the amount of deferred tax assets that can be recognised, based upon the likely timing and level of future taxable profits, together with future tax-planning strategies.
Refer Note 7.2 for details.
2.10.10 Defined Benefit Obligation
The cost of the defined benefit plans is determined using an actuarial valuation. The actuarial valuation involves making assumptions about discount rates, expected rates of return on assets, future salary increases, mortality rates and future pension increases, etc. Due to the long term nature of these plans, such estimates are subject to significant uncertainty.
Refer Note 47 for the assumptions used.
2.10.11 Provisions for Liabilities, Commitments and Contingencies
The Group receives legal claims against it in the normal course of business. Management has made judgements as to the likelihood of any claim succeeding in making provisions. The time of concluding legal claims is uncertain, as is the amount of possible outflow of economic benefits. Timing and cost ultimately depend on the due process in respective legal jurisdictions.
Information about significant areas of estimation uncertainty and critical judgements in applying Accounting Policies other than those stated above that have significant effects on the amounts recognised in the Consolidated Financial Statements, are described in Notes 5.11 to 5.17 on this page.
2.11 Events After the Reporting Period
Events after the Reporting period are those events, favourable and unfavourable, that occur between the Reporting date and the date when the Financial Statements are authorised for issue.
In this regard, all material and important events that occurred after the Reporting period have been considered and appropriate disclosures are made in Note 66 where necessary.
3. Financial Risk Management
Risk is inherent in the Bank’s activities, but is managed through a process of ongoing identification, measurement and monitoring, subject to risk limits and other controls. This process of risk management is critical to the Bank’s continuing profitability and each individual within the Bank is accountable for the risk exposures relating to his or her responsibilities. The Bank is exposed to;
Credit Risk
The risk that the Bank will incur a loss because its customers or counterparties fail to discharge their contractual obligations.
The Bank manages and controls credit risk by setting limits on the amount of risk it is willing to accept for individual counterparties and for geographical and industry concentrations and by monitoring exposures in relation to such limits.
Market Risk
The risk that the fair value or future cash flows of financial instruments will fluctuate due to changes in market variables such as interest rates, foreign exchange rates and equity prices. The Bank classifies exposures to market risk into either trading or non-trading portfolios and manages each of those portfolios separately.
The market risk for the trading portfolio is monitored and managed closely.
Liquidity Risk
The risk that the Bank will encounter difficulty in meeting obligations associated with financial liabilities that are settled by delivering cash or another financial asset. Liquidity risk arises because of the possibility that the Bank might be unable to meet its payment obligations when they fall due under both normal and stress circumstances.
To limit this risk, Management has arranged for diversified funding sources in addition to its core deposit base and adopted a policy of managing assets with liquidity in mind and monitoring future cash flows and liquidity on a daily basis. The Bank has developed internal control processes and contingency plans for managing liquidity risk. This incorporates an assessment of expected cash flows and the availability of high grade collateral which could be used to secure additional funding if required.
Operational Risk
The risk of loss arising from systems failure, human error, fraud or external events. When controls fail to operate effectively, operational risks can cause damage to reputation, have legal or regulatory implications or lead to financial loss. The Bank cannot expect to eliminate all operational risks, but it endeavours to manage these risks through a control framework and by monitoring and responding to potential risks.
Controls include effective segregation of duties, access, authorisation and reconciliation procedures, staff education and assessment processes, such as the use of internal audit.
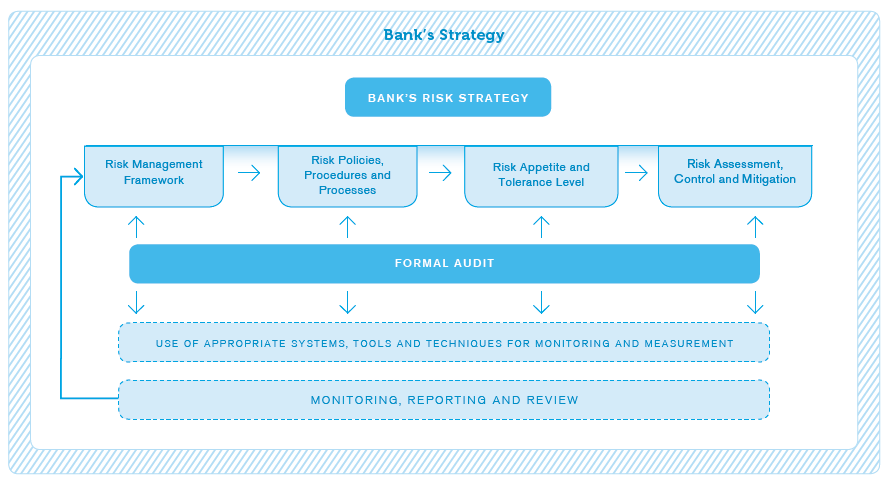
Bank’s Risk Management Framework
The Board of Directors of the Bank has the overall responsibility for the establishment and oversight of the Bank’s Risk Management Framework.
The Risk Management Policy of the Bank translates overall risk appetite on business activities in a holistic approach to provide the guidance required for convergence of strategic and risk perspectives of the Bank.
The Risk Management Policy Framework constitutes the Credit Policy, Lending Guidelines, ALM Policy including Liquidity Risk Policy, Foreign Exchange Policy, Operational Risk Policy, IT Risk Management Policy, Market Risk Management Policy, Stress Testing Policy, etc. which have been firmly established to provide control and guidance for decision-making throughout the Bank in an uniform manner.
The Committee structure embedded to the system acts as a fact finding and decision making authority through meaningful discussions of multiple points of view. The Risk Management committees effectively deliberate on matters at hand to provide guidance to the business lines with a view to managing risk in accordance with the strategic goals and risk appetite of the Bank.
The Board of Directors of the Bank has formed a mandatory Sub-Committee namely, the Board Integrated Risk Management Committee (BIRMC) as per Banking Act Direction No. 11 of 2007 on Corporate Governance. The performance of the Committee and the duties and roles of members are reviewed by the Board annually.
The meetings of the Executive Integrated Risk Management Committee (EIRMC) are conducted on a monthly basis to discuss Credit and Operational risk matters of the Bank while priority is given for liquidity and market risks at the ALCO meetings that convene at least once in fortnight.
In addition, the Risk Management Department carries out semi-annual Bank-wide risk assessment function focusing on adherence to laws, regulations and regulatory guidelines as well as internal controls and approved policies. A dedicated Compliance Department is entrusted with the responsibility of monitoring these requirements on an ongoing basis.
Further, the Management Audit function of the Bank independently monitors and evaluates the risk management function of the Bank and provides their views on adequacy of the Risk Management Framework to the Board Audit Committee.
Bank’s Financial Risk Management Framework
Management of Credit Risk
Lending Guidelines of the Bank formulated in consultation with Lending Units provides expected granularity of credit assessment, risk grading, their acceptability of collateral, etc. as well as limits on exposures and concentration levels to various sectors, counter parties, geographies and segments.
A robust risk grading system incorporating Basel requirement of facility rating and counterparty ratings is adopted by the Bank for evaluation of credit proposals. This risk grading framework consists of 10 grades of varying degrees of risk as an indicator for the Lending Officers to evaluate and arrive at suitable risk-reward trade-offs in their propositions. These risk grades are reviewed by the Integrated Risk Management Department regularly.
Portfolio level credit risk analyses are taken up at monthly EIRMC as well as quarterly BIRMC meetings. Individual credit proposals evaluated by the Lending Officers are approved by the Authorising Officers within the hierarchy in Delegated Authority Levels whilst ensuring a minimum of four eyes principle when approving any lending proposals. Escalation of approving levels occurs based on exposure levels as well as final risk ratings of borrowers.
The Executive Credit Committee (ECC) and the Board Credit Committee (BCC) are entrusted with high value approval of facilities while the Board will be the ultimate authority for approving facilities beyond predetermined threshold levels.
Deliberations take place at BCC level on facilities taken up for approval within the specified threshold and recommendation for approval of the Board based on quantum of exposures proposed is exercised.
The Risk Management Department provides risk approval for individual proposals above predetermined threshold levels, consequent to a rigorous independent risk evaluation guided by Credit Policy, Lending Guidelines and circular instructions within a limit framework stemming from risk appetite of the Bank.
Management of Liquidity Risk
Market Risk Management Policy and the ALCO Policy of the Bank approved by the Board of Directors sets the tone for managing liquidity risk of the Bank. Liquidity risk of the Bank is given utmost priority when managing a wide range of other risks due to the fact that it is considered as the most critical risk for any financial institution.
The Bank’s Treasury Department is entrusted with managing liquidity of the Bank on real-time basis to ensure smooth functioning of business activities at all other business units of the Bank.
Having access to a substantial stable Current Account and Savings Account (CASA) base due to its wide branch network and the top of the mind perception created in the depositors in general, for stability provides immense strength to the Bank in managing liquidity.
Having high quality liquid assets at the disposal of the Bank is another plus factor for the Bank. The strength of such was amply reflected in the new Basel III parallel computation the Bank carries out for arriving at Liquidity Coverage Ratio as per the CBSL guidelines that recorded very healthy results as compared to regulatory minimum threshold levels.
Contingency funding plans available, constant monitoring of salient liquidity ratios and scenario based stress testing being carried out regularly, provide the sense of Bank with required indicators enabling the Bank to take proactive measures that could provide time to overcome any adverse liquidity position on a future date.
Management of Market Risk
Market Risk Policy, ALCO Policy and Foreign Exchange Risk Policy are the three main policies that constitute the framework governing the Market Risk Management function of the Bank.
Due to the business model adopted by the Bank exposure to equity and commodity risk was kept at bay throughout the year.
However, Interest Rate Risk arising from the Banking Book as well as Trading Book and Foreign Exchange Risk arising from dealing in currencies other than local currency, continued to expose the Bank to associated risk elements.
Low interest scenarios experienced by the country during the period, impacted the financial market in Sri Lanka mainly through shrinking Net Interest Margin. Interest Rates of the Banking Book was subjected to varying degrees of rate shocks to identify impact on earnings perspective in such rate scenarios. The results reflected predictions which assisted the Bank in formulating strategies to manage the financial position in an effective manner with the limited choices available.
Trading book too was subjected to Value at Risk (VaR) framework as described in the section on ‘Managing Risk at Commercial Bank’. The Bank also carried out sensitivity analysis on a regular basis to ascertain the impact on portfolios maintained, mainly in Government Securities and marking-to-market such portfolios to reflect fair value for decision making process.
Foreign exchange positions were maintained within the regulatory framework in a market where much stability was observed in the major currency that the Bank deals in, i.e. USD. The positions were subjected to sensitivity analysis to provide insight to possible losses/gains arising from currency appreciation/depreciations, respectively as the reporting currency of the Bank being LKR. Despite political turmoil experienced in Russia/Ukraine and Middle Eastern countries during this year, the Bank’s FX risk position remains relatively unscathed due to not having position in currencies of such origins.
Operational Risk Management
Sound Operational Risk Management practices are embedded in to the work process through Bank’s culture, internal policy framework and as per regulatory requirements.
Circular instructions and Operational Risk Management Policy play a major part in bringing together business practices with accepted benchmarks to ensure minimum disruption to processes, personnel, technology and infrastructure.
Internal control framework and Audit function with firmly established ‘three lines of defense’ serve the Bank to manage Operational Risk at current acceptable levels.
Risk and Control Self Assessment (RCSA) framework is adopted to identify risks involved in business activities of the Bank and to implement appropriate mitigatory measures after assessing criticality of such risks.
IT Risk of the Bank is managed through strict monitoring of Key IT Risk Indicators while Vulnerability Assessment and Penetration Tests are being carried out by both internal and external parties at regular intervals to identify the relevant risks.
Refer Note 65 for ‘Financial Risk Review’.
A detailed write up on how the Risk Management is carried out within the Bank’s Financial Risk Management Framework with due consideration given to factors such as governance, identification, assessment, monitoring, reporting and mitigation, are discussed in detail in the Section on ‘Managing Risk at Commercial Bank’. The write up referred to above does not form part of the Financial Statement.
4. Fair Value Measurement
‘Fair value’ is the price that would be received to sell an asset or paid to transfer a liability in an orderly transaction between market participants at the measurement date. The fair value measurement is based on the presumption that the transaction to sell the asset or transfer the liability takes place either:
- In the principal market for the asset or liability, or
- In the absence of a principal market, in the most advantageous market for the asset or liability
The principal or the most advantageous market must be accessible to the Group.
The fair value of an asset or a liability is measured using the assumptions that market participants would use when pricing the asset or liability, assuming that market participants act in their economic best interest.
A fair value measurement of a non-financial asset takes into account a market participant's ability to generate economic benefits by using the asset in its highest and best use or by selling it to another market participant that would use the asset in its highest and best use. External professional valuers are involved for valuation of significant assets such as land and building.
Fair Value Hierarchy
The Group measures the fair value using the following fair value hierarchy, which reflects the significance of the inputs used in making the measurement.
Level 1
Inputs that are unadjusted quoted market prices in an active market for identical instruments
When available, the Group measures the fair value of an instrument using active quoted prices or dealer price quotations (assets and long positions are measured at a bid price; liabilities and short positions are measured at an ask price), without any deduction for transaction costs. A market is regarded as active if transactions for asset or liability take place with sufficient frequency and volume to provide pricing information on an ongoing basis.
Level 2
Inputs other than quoted prices included within Level that are observable either directly (i.e. as prices) or indirectly (i.e. derived from prices)
This category includes instruments valued using;
- quoted market in active markets for similar instruments,
- quoted prices for identical or similar instruments in markets that are considered to be less active, or
- other valuation techniques in which almost all significant inputs are directly or indirectly observable from market data.
Level 3
Inputs that are unobservable
This category includes all instruments for which the valuation technique includes inputs not based on observable data and the unobservable inputs have a significant effect on the instrument’s value.
Valuation techniques include net present value and discounted cash flow models comparison with similar instruments for which observable market prices exist, option pricing models and other valuation models.
Assumptions and inputs used in valuation techniques include risk-free and benchmark interest rates, risk premiums in estimating discount rates, bond and equity prices, foreign exchange rates, expected price volatilities and corrections.
Observable prices or model inputs such as market interest rates are usually available in the market for listed equity securities and government securities such as treasury bills and bonds. Availability of observable prices and model inputs reduces the need for management judgement and estimation while reducing uncertainty associated in determining the fair values.
Models are adjusted to reflect the spread for bid and ask prices to reflect costs to close out positions, credit and debit valuation adjustments, liquidity spread and limitations in the models. Also, profit or loss calculated when such financial instruments are first recorded (‘Day 1’ profit or loss) is deferred and recognised only when the inputs become observable or on derecognition of the instrument.
An analysis of fair value measurement of financial and non-financial assets and liabilities is provided in Note 25.
Significant Accounting Policies
The Accounting Policies set out below have been applied consistently to all periods presented in the Financial Statements of the Group, unless otherwise indicated.
These Accounting Policies have been applied consistently by Group entities.
Set out below is an index of Significant Accounting Policies, the details of which are available on the pages that follows:
| 5 | Significant accounting policies - recognition of assets and liabilities |
| 5.1 | Basis of consolidation |
| 5.2 | Foreign currency |
| 5.3 | Financial instruments - initial recognition, classification and subsequent measurement |
| 5.4 | Non-current assets held-for-sale and disposal groups |
| 5.5 | Leases |
| 5.6 | Property, plant & equipment |
| 5.7 | Intangible assets |
| 5.8 | Impairment of non-financial assets |
| 5.9 | Dividends payable |
| 5.10 | Employee benefits |
| 5.11 | Other liabilities |
| 5.12 | Provisions |
| 5.13 | Restructuring |
| 5.14 | Onerous contracts |
| 5.15 | Financial guarantees and loan commitments |
| 5.16 | Commitments |
| 5.17 | Contingent liabilities and commitments for leasing arrangements |
| 5.18 | Stated capital and reserves |
| 5.19 | Earnings Per Share (EPS) |
| 5.20 | Operating segments |
| 5.21 | Fiduciary assets |
| 6 | Significant accounting policies - recognition of income and expenses |
| 6.1 | Interest income and expense |
| 6.2 | Fees and commission income and expense |
| 6.3 | Net gains/(losses) from trading |
| 6.4 | Dividend income |
| 6.5 | Lease income |
| 6.6 | Lease payments |
| 6.7 | Rental income and expenses |
| 7 | Significant accounting policies - income tax expense |
| 7.1 | Current taxation |
| 7.2 | Deferred taxation |
| 7.3 | Tax exposures |
| 7.4 | Crop Insurance Levy (CIL) |
| 7.5 | Withholding tax on dividends distributed by the bank, subsidiaries and associates |
| 7.6 | Economic Service Charge (ESC) |
| 7.7 | Value added tax on financial services |
| 7.8 | Nation Building Tax on financial services (NBT) |
| 8 | Statement of Cash Flows |
5. Significant Accounting Policies - Recognition of Assets and Liabilities
5.1 Basis of Consolidation
The Group’s Financial Statements comprise consolidation of the Financial Statements of the Bank, its Subsidiaries in terms of the Sri Lanka Accounting Standard - SLFRS 10 on ‘Consolidated and Separate Financial Statements’ and the proportionate share of the profit or loss and net assets of its Associates in terms of the Sri Lanka Accounting Standard - LKAS 28 on ‘Investments in Associates and Joint Ventures’. The Bank’s Financial Statements comprise the amalgamation of the Financial Statements of the Domestic Banking Unit, the Off-Shore Banking Centre and the international operations of the Bank.
5.1.1 Business Combinations
Business combinations are accounted for using the acquisition method when control is transferred to the Group (Refer Note 5.1.3 below). The consideration transferred in the acquisition is generally measured at fair value, as are the identifiable net assets acquired. Any goodwill that arises is tested annually for impairment (Refer Note 5.7.3.1.1). Any gain on a bargain purchase is recognised in profit or loss immediately. Transaction costs are expensed as incurred, except if they are related to the issue of debt or equity securities.
5.1.2 Non-Controlling Interests (NCI)
NCI are measured at their proportionate share of the acquiree’s identifiable net assets at the date of acquisition. Changes in the Group’s interest in a subsidiary that do not result in a loss of control are accounted for as equity transactions.
5.1.3 Subsidiaries
Subsidiaries are investees controlled by the Group. The Group ‘controls’ an investee if it is exposed to, or has rights to, variable returns from its involvement with the investee and has the ability to affect those returns through its power over the investee. The Group reassesses whether it has control if there are changes to one or more of the elements of control. This includes circumstances in which protective rights held (e.g. those resulting from a lending relationship) become substantive and lead to the Group having power over an investee.
The cost of an acquisition is measured at fair value of the consideration, including contingent consideration. The acquired identifiable assets, liabilities and contingent liabilities are measured at their fair values at the date of acquisition. Subsequent to the initial measurement the Bank continues to recognise the investments in Subsidiaries at cost.
The Financial Statements of subsidiaries are included in the Consolidated Financial Statements from the date on which control commences until the date when control ceases.
The Financial Statements of all subsidiaries in the Group have a common financial year which ends on December 31, except for the Indra Finance Ltd., a licensed finance company, whose financial year ends on March 31. The Financial Statements of the Bank’s Subsidiaries are prepared using consistent accounting policies.
The reason for using a different Reporting date by the aforesaid subsidiary is due to the requirement imposed by the Central Bank of Sri Lanka for licensed finance companies to publish their key financial data and key performance indicators for 12-month period ended March 31 and 6 months period ended September 30, every year, in accordance with a format prescribed by the Director of the Department of Supervision of Non-Bank Financial Institutions of the Central Bank of Sri Lanka.
All intra-group balances, transactions, unrealised gains and losses resulting from intra-group transactions, income and expenses are eliminated in full.
There are no significant restrictions on the ability of Subsidiaries to transfer funds to the Parent (the Bank) in the form of cash dividend or repayment of loans and advances.
All Subsidiaries of the Bank have been incorporated in Sri Lanka except Commex Sri Lanka S.R.L. which was incorporated in Italy.
A listing of the Bank’s Subsidiaries together with contingencies of Subsidiaries is set out in Notes 34 and 55.4 (a).
The summarised financial information of all its Subsidiaries including total assets, total liabilities, revenue, profit or loss and the dividend paid, business address, etc are given in the Section on ‘Group Structure’.
5.1.4 Transactions Eliminated on Consolidation
Intra-group balances and transactions, and any unrealised income and expenses (except for foreign currency transaction gains or losses) arising from intra-group transactions, are eliminated in preparing the Consolidated Financial Statements. Unrealised losses are eliminated in the same way as unrealised gains, but only to the extent that there is no evidence of impairment.
5.1.5 Loss of Control
When the Group loses control over a subsidiary, it derecognises the assets and liabilities of the subsidiary, and any related NCI and other components of equity. Any resulting gain or loss is recognised in Income Statement. Any interest retained in the former subsidiary is measured at fair value when control is lost.
Subsequently, it is accounted for as an Associate or in accordance with the Group’s Accounting Policy for financial instruments depending on the level of influence retained.
5.1.6 Associates
Associates are those entities in which the Group has significant influence, but not control, over the variable returns through its power over the investee. Significant influence is presumed to exist when the Group holds 20% or more of the voting power of another entity.
Investments in associates are accounted for using the equity method and are recognised initially at cost, in terms of Sri Lanka Accounting Standards - LKAS 28 on ‘Investments in Associates and Joint venture’. The Group’s investment includes goodwill identified on acquisition, net of any accumulated impairment losses. The Consolidated Financial Statements include the Group’s share of the income and expenses and equity movements of equity-accounted investees, after adjustments to align the Accounting Policies with those of the Group, from the date that significant influence commences until the date that significant influence ceases. Accordingly, under the Equity Method, investments in Associates are carried at cost plus post-acquisition changes in the Group’s share of net assets of the Associates and are reported as a separate line item in the Statement of Financial Position. The Income Statement reflects the Group’s share of the results of operations of the Associates. Any change in OCI of those investees is presented as part of the Group’s OCI. In addition, when there has been a change recognised directly in the equity of the associate, the Group recognises its share of any changes, when applicable, in Equity through OCI. Unrealised gains and losses resulting from transactions between the Group and the Associate are eliminated to the extent of the interest in Associate.
When the Group’s share of losses exceeds its interest in an equity-accounted investee, the carrying amount of that interest, including any long term investments, is reduced to nil and the recognition of further losses is discontinued except to the extent that the Group has an obligation or has made payments on behalf of the investee. If the Associate subsequently reports profits, the Group resumes recognising its share of those profits only after its share of the profits equal the share of losses not recognised previously.
The Group discontinues the use of the Equity Method from the date that it ceases to have significant influence over an Associate and accounts for such investments in accordance with the Sri Lanka Accounting Standard - LKAS 39 on ‘Financial Instruments: Recognition and Measurement’.
Upon loss of significant influence over the Associate, the Group measures and recognises any retained investment at its fair value. Any difference between the carrying amount of the Associate upon loss of significant influence and the fair value of the retained investment and proceeds from disposal is recognised in profit or loss.
After application of the Equity Method, the Group determines whether it is necessary to recognise an impairment loss on its investment in its Associate. At each Reporting date, the Group determines whether there is objective evidence that the investment in the Associate is impaired. If there is such evidence, the Group calculates the amount of impairment as the difference between the recoverable amount of the Associate and its carrying value then recognises the loss as ‘Share of profit of an Associate’ in the Income Statement.
The Financial Statements of all Associates in the Group have a common financial year which ends on December 31.
There are no significant restrictions on the ability of the Associates to transfer funds to the Parent (the Bank) in the form of cash dividend or repayment of loans and advances.
A listing of the Group’s Associates together with their fair values and the Group’s share of contingent liabilities of such Associates are set out in Notes 35 and 55.4 (b).
Summarised financial information of all Associates of the Bank together with the Bank’s interests is given in the Section on ‘Group Structure’.
5.1.7 Material Gains or Losses, Provisional Values or Error Corrections
There were no material gains or losses, provisional values or error corrections recognised during the year in respect of the business combinations that took place in previous periods.
5.2 Foreign Currency
5.2.1 Foreign Currency Translations
The Group’s Consolidated Financial Statements are presented in Sri Lankan Rupees, which is also the Bank’s functional currency. The Financial Statements of the Off-Shore Banking centre of the Bank and the Financial Statements of the Foreign Operations of the Bank have been translated into the Group’s Presentation Currency as explained under Notes 5.2.3 and 5.2.4 below:
5.2.2 Foreign Currency Transactions and Balances
Foreign currency transactions are translated into the Functional Currency, which is Sri Lankan Rupees, using the exchange rates prevailing at the dates of the transactions. In this regard, the Bank’s practice is to use the middle rate of exchange ruling at the date of the transaction.
Monetary assets and liabilities denominated in foreign currencies at the Reporting date are retranslated to the Functional Currency at the middle exchange rate of the Functional Currency ruling at the Reporting date. The foreign currency gain or loss on monetary items is the difference between amortised cost in the Functional Currency at the beginning of the year adjusted for effective interest and payments during the year, and the amortised cost in foreign currency translated at the exchange rate at the Reporting date.
Non-monetary assets and liabilities denominated in foreign currencies that are measured at fair value are retranslated to the Functional Currency at the exchange rate at the date that the fair value was determined. Foreign currency differences arising on retranslation are recognised in profit or loss, except for differences arising on the retranslation of available-for-sale equity instruments, a financial liability designated as a hedge of the net investment in a foreign operation, or qualifying cash flow hedges, which are recognised in OCI. Non-monetary items that are measured in terms of historical cost in a foreign currency are translated using the exchange rate at the date of the transaction.
5.2.3 Transactions of the Off-Shore Banking Centre
These are recorded in accordance with Note 5.2.2 above, except the application of the annual weighted average exchange rate for translation of the Income Statement and Statement of Profit or Loss and Other Comprehensive Income. Net gains and losses are dealt through the Profit or Loss.
5.2.4 Foreign Operations
The results and financial position of overseas operations that have a Functional Currency different from the Bank’s Presentation Currency are translated into the Bank’s Presentation Currency as follows:
- Assets and liabilities are translated at the rates of exchange ruling at the Reporting date.
- Income and expenses are translated at the average exchange rate for the period, unless this average rate is not a reasonable approximation of the rate prevailing at the transaction date, in which case income and expenses are translated at the exchange rates ruling at the transaction date.
- All resulting exchange differences are recognised in the in the OCI and accumulated in the Foreign Currency Translation Reserve (Translation Reserve), which is a separate component of Equity, except to the extent that the translation difference is allocated to the NCI.
When a Foreign Operation is disposed of such that control is lost, the cumulative amount in the Translation Reserve related to that foreign operation is reclassified to profit or loss. If the Group disposes of only part of its interest in a subsidiary that includes a Foreign Operation while retaining control, then the relevant proportion of the cumulative amount of the Translation Reserve is reattributed to NCI.
Goodwill arising on the acquisition of a Foreign Operation and any fair value adjustments to the carrying amounts of assets and liabilities arising on the acquisition are treated as assets and liabilities of the Foreign Operation and are translated at the exchange rates ruling at the Reporting date.
5.3 Financial Instruments - Initial Recognition, Classification and Subsequent Measurement
5.3.1 Date of Recognition
The Group initially recognises loans and advances, deposits, debt securities issued and subordinated liabilities on the date on which they are originated. All other financial instruments (including regular-way purchases and sales of financial assets) are recognised on the trade date, which is the date on which the Group becomes a party to the contractual provisions of the instrument.
5.3.2 Initial Measurement of Financial Instruments
The classification of financial instruments at initial recognition depends on their purpose and characteristics and the Management’s intention in acquiring them. Please refer Notes 5.3.3 and 5.3.4 for further details on classification of financial instruments.
All financial instruments are measured initially at their fair value plus transaction costs that are directly attributable to acquisition or issue of such financial instrument, except in the case of financial assets and financial liabilities at fair value through profit or loss as per the Sri Lanka Accounting Standard - LKAS 39 on ‘Financial Instruments: Recognition and Measurement’.
Transaction cost in relation to financial assets and financial liabilities at fair value through profit or loss are dealt with through the Income Statement.
5.3.2.1 ‘Day 1’ Profit or Loss
When the transaction price differs from the fair value of other observable current market transactions in the same instrument, or based on a valuation technique whose variables include only data from observable markets, the Group recognises the difference between the transaction price and fair value (a ‘Day 1’ profit or loss) in ‘Interest Income and Personnel Expenses’. In cases where fair value is determined using data which is not observable, the difference between the transaction price and model value is only recognised in the profit or Loss when the inputs become observable, or when the instrument is derecognised. The ‘Day 1 loss’ arising in the case of loans granted to employees at concessionary rates under uniformly applicable schemes is deferred and amortised using Effective Interest Rates (EIR) over the remaining service period of the employees or tenure of the loan whichever is shorter.
Refer Note 6.1 given below.
5.3.3 Classification and Subsequent Measurement of Financial Assets
Group classifies financial assets into one of the following categories:
- Financial Assets at fair value through profit or loss, and within this category as;
- held for trading; or
- designated at fair value through profit or loss.
- Loans and receivables;
- Held-to-maturity;
- Available-for-sale; and
The Subsequent measurement of financial assets depends on their classification.
Please refer Notes 5.3.3.1 to 5.3.3.7 for details on different types of financial assets recognised on the Statement of Financial Position.
5.3.3.1 Financial Assets at Fair Value through Profit or Loss
Financial assets at fair value through profit or loss include financial assets held for trading and financial assets designated upon initial recognition at fair value through profit or loss which are discussed in Notes 5.3.3.1.1 and 5.3.3.1.2 below:
5.3.3.1.1 Financial Assets Held-for-Trading
Financial assets are classified as held for trading if;
- they are acquired principally for the purpose of selling or repurchasing in the near term; or
- they hold as a part of a portfolio that is managed together for short-term profit or position taking; or
- they form part of derivative financial instruments entered into by the Group that are not designated as hedging instruments in hedge relationships as per the Sri Lanka Accounting Standard - LKAS 39 on ‘Financial Instruments: Recognition and Measurement’.
Financial assets held for trading are recorded in the Statement of Financial Position at fair value. Changes in fair value are recognised in profit or loss. Interest and dividend income are recorded in ‘Interest Income’ and ‘Net Gains/(Losses) from Trading’ respectively in the Income Statement according to the terms of the contract, or when the right to receive the payment has been established.
The Group evaluates its financial assets held for trading, other than derivatives, to determine whether the intention to sell them in the near term is still appropriate. When the Group is unable to trade these financial assets due to inactive markets and Management’s intention to sell them in the foreseeable future significantly changes, the Group may elect to reclassify these financial assets in rare circumstances.
Financial assets held for trading include instruments such as Government and other debt securities and equity instruments that have been acquired principally for the purpose of selling or repurchasing in the near term and derivatives, including separated embedded derivatives explained below unless they are designated as effective hedging instruments.
Details of financial assets held for trading are given in Note 30.
Derivatives Recorded at Fair Value through Profit or Loss
The Bank uses derivatives such as interest rate swaps, foreign currency swaps and forward foreign exchange contracts, etc. Derivatives are recorded at fair value and carried as assets when their fair value is positive. Changes in the fair value of derivatives are included in ‘Net Gains/(Losses) from Trading’ (under customers) in the Income Statement.
Derivatives embedded in other financial instruments are treated as separate derivatives and recorded at fair value if their economic characteristics and risks are not closely related to those of the host contract, and the host contract is not itself held for trading or designated at fair value through profit or loss. The embedded derivatives separated from the host are carried at fair value in the trading portfolio with changes in fair value recognised in the profit or loss.
Details of derivative financial assets recorded at fair value through profit or loss are given in Note 29.
5.3.3.1.2 Financial Assets Designated at Fair Value through Profit or Loss
The Group designates financial assets at fair value through profit or loss in the following circumstances:
- the assets are managed, evaluated and reported internally at fair value; or
- the designation eliminates or significantly reduces an accounting mismatch, which would otherwise have arisen; or
- the asset contains an embedded derivative that significantly modifies the cash flows that would otherwise have been required under the contract.
Financial assets designated at fair value through profit or loss are recorded in the Statement of Financial Position at fair value. Changes in fair value are recorded in ‘Net gain or loss on financial assets and liabilities designated at fair value through profit or loss’. Interest earned is accrued in ‘Interest Income’, using the EIR, while dividend income is recorded in ‘other operating income’ when the right to receive the payment has been established.
The Group has not designated any financial assets upon initial recognition as at fair value through profit or loss.
5.3.3.2 Loans and Receivables to Banks and Other Customers
‘Loans and receivables to banks and other customers’ comprised of non-derivative financial assets with fixed or determinable payments that are not quoted in an active market, other than:
- those that the Group intends to sell immediately or in the near term and those that the Group, upon initial recognition, designates as at fair value through profit or loss
- those that the Group, upon initial recognition, designates as available-for-sale
- those for which the Group may not recover substantially all of its initial investment, other than because of credit deterioration.
‘Loans and receivable to banks and other customers’ include Amounts due from banks, Loans & Advances, Lease Receivable and Securities purchased under resale agreements of the Group.
When the Group is the lessor in a lease agreement that transfers substantially all of the risks and rewards incidental to ownership of the asset to the lessee, the arrangement is classified as a finance lease. Amounts receivable under finance leases net of initial rentals received, unearned lease income and provision for impairment are classified as lease receivable and are presented within ‘Loans and receivables to customers’ in the Statement of Financial Position.
After initial measurement, ‘Loans and receivables to banks and other customers’ are subsequently measured at amortised cost using the EIR, less provision for impairment except when the Group designates loans and receivables at fair value through profit or loss. Amortised cost is calculated by taking into account any discount or premium on acquisition and fees and costs that are an integral part of the EIR. The amortisation is included in ‘Interest Income’ while the losses arising from impairment are recognised in ‘Impairment charges for loans and other losses’ in the Income Statement.
The Bank may enter into certain lending commitments where the loan, on draw down, is expected to be classified as held for trading because the intent is to sell the loans in the short term. These commitments to lend, if any, are recorded as derivatives and measured at fair value through profit or loss. Where the loan, on drawdown, is expected to be retained by the Bank, and not sold in the short term, the commitment is recorded only when it is an onerous contract that is likely to give rise to a loss.
Details of ‘Loans and receivables to banks and other customers’ are given in Notes 31 and 32.
5.3.3.2.1 Securities Purchased Under Resale Agreements (Reverse Repos)
When the Group purchases a financial asset and simultaneously enters into an agreement to resale the asset (or a similar asset) at a fixed price on a future date (Reverse Repo), the arrangement is accounted for as a financial asset in the Statement of Financial Position reflecting the transaction’s economic substance as a loan granted by the Group. Subsequent to initial recognition, these securities issued are measured at their amortised cost using the EIR method with the corresponding interest receivable being recognised as interest income in profit or loss.
Details of ‘Securities purchased under resale agreements’ are given in Note 32.1(a).
5.3.3.3 Other Financial Investments Classified as Loans and Receivables
‘Other financial investments classified as loans and receivables’ include unquoted debt instruments. After initial measurement, these are subsequently measured at amortised cost using the EIR, less provision for impairment. Amortised cost is calculated by taking into account any discount or premium on acquisition and fees and costs that are an integral part of the EIR. The amortisation is included in ‘Interest Income’ while the losses arising from impairment are recognised in ‘Impairment charges for loans and other losses’ in the Income Statement.
Details of ‘Other financial investments classified as loans and receivables’ are given in Note 32.
5.3.3.4 Financial Investments – Available-for-Sale
Available-for-sale financial investments include equity and debt securities. Equity investments classified as available-for-sale are those which are neither classified as held for trading nor designated at fair value through profit or loss. Debt securities in this category are intended to be held for an indefinite period of time and may be sold in response to needs for liquidity or in response to changes in the market conditions.
Derivatives are recorded at fair value and carried as liabilities when their fair value is negative.
The Group has not designated any loans or receivables as available-for-sale.
After initial measurement, available-for-sale financial investments are subsequently measured at fair value.
Unrealised gains and losses are recognised in Equity through OCI in the ‘Available-for-sale reserve’. When these financial investments are disposed of, the cumulative gain or loss previously recognised in Equity is recycled to profit or loss in ‘Other operating income’. Interest earned whilst holding available-for-sale financial investments is reported as ‘Interest Income’ using the EIR. Dividend earned whilst holding available-for-sale financial investments are recognised in the Income Statement as ‘Other operating income’ when the right to receive the payment has been established. The losses arising from impairment of such investments too are recognised in the Income Statement in ‘Impairment losses on financial investments’ and removed from the ‘Available-for-sale reserve’.
Details of Financial Investments – Available-for-Sale are given in Note 33.
5.3.3.5 Financial Investments – Held-to-Maturity
Held- to-maturity financial investments are non-derivative financial assets with fixed or determinable payments and fixed maturities, which the Group has the intention and ability to hold-to-maturity. After initial measurement, held-to-maturity financial investments are subsequently measured at amortised cost using the EIR, less impairment. Amortised cost is calculated by taking into account any discount or premium on acquisition and fees that are an integral part of the EIR. The amortisation is included in ‘Interest Income’ while the losses arising from impairment of such investments are recognised in ‘Impairment charges for loans and other losses’ in the Income Statement.
If the Group were to sell or reclassify more than an insignificant amount of held-to-maturity investments before maturity (other than in certain specific circumstances permitted in the Sri Lanka Accounting Standard - LKAS 39 on ‘Financial Instruments: Recognition and Measurement’), the entire category would be tainted and would have to be reclassified as available-for-sale. Furthermore, the Group would be prohibited from classifying any financial asset as held-to-maturity during the following two years.
The Group has not designated any financial instrument as held-to-maturity financial investment.
5.3.3.6 Cash and Cash Equivalents
Cash and cash equivalents include cash in hand, placements with banks and loans at call and at short notice that are subject to an insignificant risk of changes in their fair value and are used by the Group in the management of its short term commitments. They are brought to Financial Statements at their face values or the gross values, where appropriate. There were no cash and cash equivalents held by the Group companies that were not available for use by
the Group.
Cash and cash equivalents are carried at amortised cost in the Statement of Financial Position.
Details of Cash and cash equivalents are given in Note 26 to the Financial Statements.
5.3.3.7 Balances with Central Banks
The Monetary Law Act requires that all commercial banks operating in Sri Lanka to maintain a statutory reserve equal to 6% on all deposit liabilities denominated in Sri Lankan Rupees (6% in 2013). The Bank’s Bangladesh operation is required to maintain the statutory liquidity requirement of 19.5% (19% in 2013) on time and demand liabilities (both local and foreign currencies), inclusive of 6.5% (6% in 2013) in the form of a Cash Reserve Requirement and the balance 13% (13% in 2013) by way of foreign currency and/or in the form of unencumbered securities held with the Bangladesh Bank.
Balances with Central Banks are carried at amortised cost in the Statement of Financial Position.
Details of the Balances with Central Banks are given in Note 27 to the Financial Statements.
5.3.4 Classification and Subsequent Measurement of Financial Liabilities
Group classifies financial liabilities into one of the following categories:
- Financial liabilities at fair value through profit or loss, and within this category as;
- Held-for-trading; or
- Designated at fair value through profit or loss.
- Financial liabilities at amortised cost
The subsequent measurement of financial liabilities depends on their classification.
Please refer Notes 5.3.4.1 and 5.3.4.2 detailed below.
5.3.4.1 Financial Liabilities at Fair Value through Profit or Loss
Financial liabilities at fair value through profit or loss include financial liabilities held-for- trading and financial liabilities designated upon initial recognition as at fair value through profit or loss. Refer Notes 5.3.4.1.1 and 5.3.4.1.2 below.
5.3.4.1.1 Financial Liabilities Held-for-Trading
Financial liabilities are classified as held-for-trading, if they are incurred principally for the purpose of repurchasing in the near term or holds as a part of a portfolio that is managed together for short term profit or position taking.
This category includes derivative financial instruments entered into by the Group that are not designated as hedging instruments in hedge relationships as per the Sri Lanka Accounting Standard - LKAS 39 on ‘Financial Instruments: Recognition and Measurement’. Separated embedded derivatives are also classified as held-for-trading unless they are designated as effective hedging instruments.
Derivatives are recorded at fair value and carried as liabilities when their fair value is negative.
Gains or losses on financial liabilities held-for-trading are recognised in the Income Statement.
Details of derivative financial liabilities are given in Note 41.
5.3.4.1.2 Financial Liabilities Designated at Fair Value through Profit or Loss
Financial liabilities designated at fair value through profit or loss are recorded in the Statement of Financial Position at fair value. Changes in fair value are recorded in ‘Net gain or loss on financial assets and liabilities designated at fair value through profit or loss’. Interest paid/ payable is accrued in ‘Interest Expense’, using the EIR.
The Group has not designated any financial liabilities upon initial recognition as at fair value through profit or loss.
5.3.4.2 Financial Liabilities at Amortised Cost
Financial instruments issued by the Group that are not designated at fair value through profit or loss, are classified as liabilities under ‘Due to Banks’, Securities sold under repurchase agreements, ‘Debt Securities Issued’ or ‘Subordinated Liabilities’ as appropriate, where the substance of the contractual arrangement results in the Group having an obligation either to deliver cash or another financial asset to the holder, or to satisfy the obligation other than by the exchange of a fixed amount of cash or another financial asset for a fixed number of own equity shares.
After initial recognition, such financial liabilities are subsequently measured at amortised cost using the EIR method. Amortised cost is calculated by taking into account any discount or premium on acquisition and fees or costs that are an integral part of the EIR. The EIR amortisation is included in ‘Interest Expenses’ in the Income Statement. Gains and losses too are recognised in the Income Statement when the liabilities are derecognised as well as through the EIR amortisation process.
5.3.4.2.1 Due to Banks
These represents refinance borrowings, call money borrowings, credit balances in Nostro Accounts and borrowings from financial institutions. Subsequent to initial recognition these are measured at their amortised cost using the EIR method. Interest paid/payable on these borrowings is recognised in profit or loss.
Details of the ‘Due to banks’ are given in Notes 40.
5.3.4.2.2 Due to Other Customers/Deposits from Customers
These include non-interest-bearing deposits, savings deposits, term deposits, deposits payable at call and certificates of deposit. Subsequent to initial recognition deposits are measured at their amortised cost using the EIR method, except where the Group designates liabilities at fair value through profit or loss. Interest paid/payable on these deposits is recognised in profit or loss.
Details of ‘Due to other customers/Deposits from customers’ are given in Note 42.
5.3.4.2.3 Debt Securities Issued
These represent the funds borrowed by the Group for long term funding requirements. Subsequent to initial recognition debt securities issued are measured at their amortised cost using the EIR method, except where the Group designates debt securities issued at fair value through profit or loss. Interest paid/payable is recognised in profit or loss.
The Group does not have any debt securities issued as at the Reporting date.
5.3.4.2.4 Securities Sold Under Resale Agreements (Repos)
When the Group sells a financial asset and simultaneously enters into an agreement to repurchase the asset (or a similar asset) at a fixed price on a future date (Repos), the arrangement is accounted for as a financial liability in the Statement of Financial Position reflecting the transaction’s economic substance as a deposit. Subsequent to initial recognition, these securities are measured at their amortised cost using the EIR method with the corresponding interest payable being recognised as interest expense in profit or loss.
The details of the Group’s Financial liabilities at amortised cost is disclosed in Notes 40, 42, 43 and 49.
5.3.5 Reclassification of Financial Assets & Liabilities
The Group reclassifies non-derivative financial assets out of the ‘held-for-trading’ category and into the ‘available-for-sale’, ‘loans and receivables’, or ‘held-to-maturity’ categories as permitted by the Sri Lanka Accounting Standard - LKAS 39 on ‘Financial Instruments: Recognition and Measurement’. Further, in certain circumstances, the Group is permitted to reclassify financial instruments out of the ‘available-for-sale’ category and into the ‘loans and receivables’ category. Reclassifications are recorded at fair value at the date of reclassification, which becomes the new amortised cost.
For a financial asset with a fixed maturity reclassified out of the ‘available-for-sale’ category, any previous gain or loss on that asset that has been recognised in Equity is amortised to profit or loss over the remaining life of the asset using the EIR. Any difference between the new amortised cost and the expected cash flows is also amortised over the remaining life of the asset using the EIR. In the case of a financial asset that does not have a fixed maturity, the gain or loss is recognised in the profit or loss when such financial asset is sold or disposed of. If the financial asset is subsequently determined to be impaired, then the amount recorded in Equity is recycled to profit or loss.
The Group may reclassify a non-derivative trading asset out of the ‘held-for-trading’ category and into the ‘loans and receivables’ category if it meets the definition of loans and receivables and the Group has the intention and ability to hold the financial asset for the foreseeable future or until maturity. If a financial asset is reclassified and if the Group subsequently increases its estimates of future cash receipts as a result of increased recoverability of those cash receipts, the effect of that increase is recognised as an adjustment to the EIR from the date of the change in estimate.
Reclassification is at the election of the Management and is determined on an instrument-by-instrument basis.
The Group does not reclassify any financial instrument into the fair value through profit or loss category after initial recognition. Further, the Group does not reclassify any financial instrument out of the fair value through profit or loss category if upon initial recognition it was designated as at fair value through profit or loss.
5.3.6 Derecognition of Financial Assets and Financial Liabilities
5.3.6.1 Financial Assets
The Group derecognises a financial asset when the contractual rights to the cash flows from the financial asset expire or it transfers the rights to receive the contractual cash flows in a transaction in which substantially all of the risks and rewards of ownership of the financial asset are transferred or in which the Group neither transfers nor retains substantially all of the risks and rewards of ownership and it does not retain control of the financial asset.
On derecognition of a financial asset, the difference between the carrying amount of the asset (or the carrying amount allocated to the portion of the asset derecognised) and the sum of the consideration received (including any new asset obtained less any new liability assumed) and any cumulative gain or loss that had been recognised in OCI is recognised in profit or loss. Any interest in transferred financial assets that qualify for derecognition that is created or retained by the Group is recognised as a separate asset or liability.
The Group enters into transactions whereby it transfers assets recognised on its Statement of Financial Position, but retains either all or substantially all of the risks and rewards of the transferred assets or a portion of them. In such cases, the transferred assets are not derecognised. Examples of such transactions are securities lending and sale and repurchase transactions.
When assets are sold to a third party with a concurrent total rate of return swap on the transferred assets, the transaction is accounted for as a secured financing transaction similar to sale and repurchase transactions because the Group retains all or substantially all of the risks and rewards of ownership of such assets.
In transactions in which the Group neither retains nor transfers substantially all of the risks and rewards of ownership of a financial asset and it retains control over the asset, the Group continues to recognise the asset to the extent of its continuing involvement, determined by the extent to which it is exposed to changes in the value of the transferred asset.
In certain transactions, the Group retains the obligation to service the transferred financial asset for a fee. The transferred asset is derecognised if it meets the derecognition criteria. An asset or liability is recognised for the servicing contract if the servicing fee is more than adequate (asset) or is less than adequate (liability) for performing the servicing.
5.3.6.2 Financial Liabilities
The Group derecognises a financial liability when its contractual obligations are discharged or cancelled or expired.
5.3.7 Offsetting of Financial Instruments
Financial assets and financial liabilities are offset and the net amount reported in the Statement of Financial Position if, and only if, there is a currently enforceable legal right to offset the recognised amounts and there is an intention to settle on a net basis, or to realise the assets and settle the liabilities simultaneously.
Income and expenses are presented on a net basis only when permitted under SLFRSs, or for gains and losses arising from a group of similar transactions such as in the Group’s trading activity.
5.3.8 Amortised Cost Measurement
An ‘amortised cost’ of a financial asset or financial liability is the amount at which the financial asset or liability is measured at initial recognition, minus principal repayments, plus or minus the cumulative amortisation using the EIR method of any difference between the initial amount recognised and the maturity amount, minus any reduction for impairment.
5.3.9 Fair Value of Financial Instruments
Fair value measurement of financial instruments including the fair value hierarchy is explained in the Note 4.
5.3.10 Identification and Measurement of Impairment of Financial Assets
At each Reporting date the Group assesses whether there is objective evidence that financial assets not carried at fair value through profit or loss are impaired. A financial asset or a group of financial assets is ‘impaired’ when objective evidence demonstrates that a loss event has occurred after the initial recognition of the asset(s) and that the loss event has an impact on the future cash flows of the asset(s) that can be estimated reliably.
Objective evidence that financial assets (including equity securities) are impaired can include:
- significant financial difficulty of the borrower or issuer,
- reschedulement of credit facilities,
- default or delinquency by a borrower,
- restructuring of a loan or advance by the Group on terms that the Group would not otherwise consider,
- indications that a borrower or issuer will enter bankruptcy,
- the disappearance of an active market for a security, or
- other observable data relating to a group of assets such as adverse changes in the payment status of borrowers or issuers in the group or economic conditions that correlate with defaults in the Group.
In addition, for an investment in an equity security, a significant or prolonged decline in its fair value below its cost is considered as an objective evidence of impairment.
5.3.10.1 Impairment of Financial Assets Carried at Amortised Cost
Individual Assessment of Impairment
For financial assets carried at amortised cost (such as amounts due from banks, loans and advances to customers as well as held to maturity investments), the Group first assesses individually whether objective evidence of impairment exists for financial assets that are individually significant or collectively for financial assets that are not individually significant. Assets that are individually assessed for impairment and for which an impairment loss is, or continues to be, recognised are not included in a collective assessment of impairment.
If there is objective evidence that an impairment loss has been incurred, the amount of the loss is measured as the difference between the asset’s carrying amount and the present value of estimated future cash flows (excluding future expected credit losses that have not yet been incurred). The carrying amount of the asset is reduced through the use of a provision account and the amount of impairment loss is recognised in profit or loss. Interest income continues to be accrued and recorded in ‘Interest Income’ on the reduced carrying amount/impaired balance and is accrued using the rate of interest used to discount the future cash flows for the purpose of measuring the impairment loss.
The present value of the estimated future cash flows is discounted at the financial asset’s original EIR. If a loan has a variable interest rate, the discount rate for measuring any impairment loss is the current EIR. If the Bank has reclassified trading assets to loans and advances, the discount rate for measuring any impairment loss is the new EIR determined at the reclassification date. The calculation of the present value of the estimated future cash flows of a collateralised financial asset, reflects the cash flows that may result from foreclosure less costs for obtaining and selling the collateral, whether or not foreclosure is probable.
Loans together with the associated impairment provision are written-off when there is no realistic prospect of future recovery and all collateral has been realised or has been transferred to the Bank. If, in a subsequent year, the amount of the estimated impairment loss increases or decreases because of an event occurring after the impairment was recognised, the previously recognised impairment loss is increased or reduced by adjusting the provision account. If a future write-off is later recovered, the recovery is credited to the ‘other income’.
Collective Assessment of Impairment
If the Group determines that no objective evidence of impairment exists for an individually assessed financial asset, it includes the asset in a group of financial assets with similar credit risk characteristics and collectively assesses them for impairment.
For the purpose of a collective evaluation of impairment, financial assets are grouped on the basis of the Bank’s internal credit grading system, that considers credit risk characteristics such as asset type, industry, geographical location, collateral type, past-due status and other relevant factors.
Future cash flows on a group of financial assets that are collectively evaluated for impairment, are estimated on the basis of historical loss experience for assets with credit risk characteristics similar to those in the group. Historical loss experience is adjusted on the basis of current observable data to reflect the effects of current conditions on which the historical loss experience is based and to remove the effects of conditions in the historical period that do not exist currently. Estimates of changes in future cash flows reflect and are directionally consistent with changes in related observable data from year-to-year such as changes in;
- Interest rates,
- Inflation rates,
- Growth in Gross Domestic Product (GDP),
- Global GDP growth rates,
- Countries’ Sovereign ratings, Ease of Doing Business Indices,
- Exchange rates,
- Political Stability,
- Portfolio factors including percentage of restructured performing loans.
The methodology and assumptions used for estimating provision for impairment including assumptions for projecting future cash flows are reviewed regularly to reduce any differences between loss estimates and actual loss experience.
Details of impairment losses and provisions (both individual and collective) on financial assets carried at amortised cost and an analysis of the impairment provision on loans and advances by class are given in Note 17 and Note 32.
Impairment of Rescheduled Loans and Advances
Where possible, the Bank seeks to reschedule loans and advances rather than to take possession of collateral. This may involve extending the payment arrangements and the agreement of new loan conditions. In case of individually significant rescheduled credit facilities, once the terms have been renegotiated, any impairment is measured using the original EIR as calculated before the modification of terms and the loan/advance is no longer considered past due. Management continually reviews renegotiated loans and advances to ensure that all criteria are met and that future repayments are likely to occur.
Collateral Valuation
The Bank seeks to use collateral, where possible, to mitigate its risks on financial assets. The collateral comes in various forms such as cash, gold, Government securities, letters of credit/guarantees, real estate, receivables, inventories, other non-financial assets and credit enhancements such as netting agreements, etc. The fair value of collateral is generally assessed, at a minimum, at inception and based on the Bank’s annual reporting schedule.
To the extent possible, the Bank uses active market data for valuing financial assets, held as collateral. Other financial assets which do not have readily determinable market values are valued using statistical models. Non-financial collateral, such as real estate, is valued based on data obtained from third parties such as professional valuers, Audited Financial Statements and other independent sources.
Collateral Repossessed
The Bank’s policy is to carry collaterals repossessed at fair value at the repossession date and such assets will be disposed at the earliest possible opportunity. These assets are recorded under assets held for sale as per the Sri Lanka Accounting Standard - SLFRS 5 on ‘Non-Current Assets Held for Sale and Discontinued Operations’.
5.3.10.2. Impairment of Financial Investments – Available-for-Sale
For available-for-sale financial investments, the Group assesses at each reporting date whether there is objective evidence that an investment is impaired.
In the case of debt instruments classified as available-for-sale, the Group assesses individually whether there is objective evidence of impairment based on the same criteria as financial assets carried at amortised cost. However, the amount recorded for impairment is the cumulative loss measured as the difference between the amortised cost and the current fair value, less any impairment loss on that investment previously recognised in profit or loss. Future interest income is based on the reduced carrying amount/impaired balance and is accrued using the rate of interest used to discount the future cash flows for the purpose of measuring the impairment loss. The interest income on such assets too is recorded within ‘Interest income’.
In the case of equity investments classified as available for sale, objective evidence would also include a ‘significant’ or ‘prolonged’ decline in the fair value of the investment below its cost. In general, the Group considers a decline of 20% to be ‘significant’ and a period of nine months to be ‘prolonged’. However, in specific circumstances a smaller decline or a shorter period may be appropriate. Where there is evidence of impairment, the cumulative impairment loss on that investment previously recognised in Equity through the OCI is removed from Equity and charged to profit or loss.
If, in a subsequent period, the fair value of an impaired available-for-sale debt instrument increases and the increase can be objectively related to an event occurring after the impairment loss was recognised, then such impairment loss is reversed through profit or loss; otherwise, any increase in fair value is recognised through OCI. Any subsequent recovery in the fair value of an available-for-sale equity instrument is always recognised in OCI.
The Group writes-off certain Financial Investments – Available-for-Sale, either partially or in full and any related provision for impairment losses, when the Group determines that there is no realistic prospect of recovery.
5.4 Non-Current Assets Held for Sale and Disposal Groups
The Group intends to recover the value of Non-current Assets and disposal groups classified as held for sale as at the Reporting date principally through a sale transaction rather than through continuing use. This condition is regarded as met only when the sale is highly probable and the asset or disposal group is available for immediate sale in its present condition, Management has committed to the sale and the sale is expected to have been completed within one year from the date of classification.
As per the Sri Lanka Accounting Standard - SLFRS 5 on ‘Non-current Assets held for Sale and Discontinued Operations’, these assets are measured at the lower of the carrying amount and fair value, less costs to sell. Thereafter, the Group assesses at each reporting date or more frequently if events or changes in circumstances indicate that the investment or a group of investment is impaired. The Group recognises an impairment loss for any initial or subsequent write down of the assets to fair value less costs to sell and also recognises a gain for any subsequent increase in fair value less costs to sell of an asset, only to the extent of the cumulative impairment losses that have been recognised previously. As a result, once classified, the Group neither amortises nor depreciates the assets classified as held for sale.
In the Income Statement of the reporting period and of the comparable period of the previous year, income and expenses from discontinued operations are reported separately from income and expenses from continuing operations, down to the level of profit after taxes, even when the Group retains a NCI in a subsidiary after the sale. The resulting profit or loss (after taxes) is reported separately in the Income Statement.
5.5 Leases
The determination of whether an arrangement is a lease or it contains a lease, is based on the substance of the arrangement and requires an assessment of whether the fulfilment of the arrangement is dependent on the use of a specific asset or assets and the arrangement conveys a right to use the asset.
5.5.1 Operating Leases
5.5.1.1 Operating Leases - Group as a Lessee
Leases that do not transfer to the Group substantially all the risks and benefits incidental to ownership of the leased assets are operating leases. Operating lease payments are recognised as an expense in the Income Statement on a straight line basis over the lease term. Contingent rental payable is recognised as an expense in the period in which they are incurred.
5.5.1.2 Operating Leases - Group as a Lessor
Leases where the Group does not transfer substantially all of the risks and benefits of ownership of the asset are classified as operating leases. Initial direct costs incurred in negotiating operating leases are added to the carrying amount of the leased asset and recognised over the lease term on the same basis as rental income.
Contingent rents are recognised as revenue in the period in which they are earned.
Details of Operating Leases are given in Note 64.
5.5.2 Finance Leases
5.5.2.1 Finance Leases - Group as a Lessee
Finance leases that transfer substantially all the risks and benefits incidental to ownership of the leased item to the Group, are capitalised at the commencement of the lease at the fair value of the leased property or, if lower, at the present value of the minimum lease payments. Lease payments are apportioned between finance charges and reduction of the lease liability so as to achieve a constant rate of interest on the remaining balance of the liability.
A leased asset is depreciated over the useful life of the asset. However, if there is no reasonable certainty that the Group will obtain ownership by the end of the lease term, the asset is depreciated over the shorter of the estimated useful life of the asset and the lease term.
5.5.2.2 Finance Leases - Group as a Lessor
When the Group is the lessor under finance leases the amounts due under the leases, after deduction of unearned charges, are included in ‘loans and advances to banks’ or ‘loans and advances to other customers’, as appropriate. The finance income receivable is recognised in ‘interest income’ over the periods of the leases so as to give a constant rate of return on the net investment in the leases.
5.6 Property, Plant & Equipment
The Group applies the requirements of the Sri Lanka Accounting Standard - LKAS 16 on ‘Property, Plant & Equipment’ in accounting for its owned assets (including buildings under operating leases where the Group is the lessor) which are held for and use in the provision of services, for rental to others or for administrative purposes and are expected to be used for more than one year.
5.6.1 Basis of Recognition
Property, Plant & Equipment are recognised if it is probable that future economic benefits associated with the asset will flow to the Group and cost of the asset can be reliably measured.
5.6.2 Basis of Measurement
An item of Property, Plant & Equipment that qualifies for recognition as an asset is initially measured at its cost. Cost includes expenditure that is directly attributable to the acquisition of the asset and subsequent costs (excluding the costs of day-to-day servicing) as explained in Note 5.6.3 below. The cost of self-constructed assets includes the cost of materials and direct labour, any other costs directly attributable to bringing the asset to a working condition for its intended use and the costs of dismantling and removing the items and restoring the site on which they are located and capitalised borrowing costs. Purchased software which is integral to the functionality of the related equipment is capitalised as part of Computer Equipment.
When parts of an item of property or equipment have different useful lives, they are accounted for as separate items (major components) of property and equipment.
5.6.2.1 Cost Model
The Group applies the Cost Model to all Property, Plant & Equipment except freehold land and freehold and leasehold buildings and records at cost of purchase together with any incidental expenses thereon, less accumulated depreciation and any accumulated impairment losses.
5.6.2.2 Revaluation Model
The Group applies the Revaluation Model for the entire class of freehold land and freehold and leasehold buildings for measurement after initial recognition. Such properties are carried at revalued amounts, being their fair value at the date of revaluation, less any subsequent accumulated depreciation on buildings and any accumulated impairment losses charged subsequent to the date of valuation. Freehold land and buildings of the Group are revalued by independent professional valuers every three years or more frequently if the fair values are substantially different from their carrying amounts to ensure that the carrying amounts do not differ from the fair values at the Reporting date.
On revaluation of an asset, any increase in the carrying amount is recognised in Revaluation Reserve in Equity through OCI or used to reverse a previous loss on revaluation of the same asset, which was charged to the Income Statement. In this circumstance, the increase is recognised as income only to the extent of the previous write down in value. Any decrease in the carrying amount is recognised as an expense in the Income Statement or charged to Revaluation Reserve in equity through OCI, only to the extent of any credit balance existing in the Revaluation Reserve in respect of that asset. Any balance remaining in the Revaluation Reserve in respect of an asset, is transferred directly to Retained Earnings on retirement or disposal of the asset.
The Group revalued all its freehold land & freehold & leasehold buildings as at December 31, 2014. Methods and significant assumptions including unobservable market inputs employed in estimating the fair value together with the sensitivity of same are given in Note 36.5 (b).
5.6.3 Subsequent Cost
Subsequent expenditure is capitalised only when it is probable that the future economic benefits of the expenditure will flow to the Group. Ongoing repairs and maintenance are expensed as incurred.
5.6.4 Derecognition
An item of Property, Plant & Equipment is derecognised upon disposal or when no future economic benefits are expected from its use. Any gain or loss arising on derecognition of the asset (calculated as the difference between the net disposal proceeds and the carrying amount of the asset), is recognised in ‘Other Income (Net)’ in profit or loss in the year the asset is derecognised.
When replacement costs are recognised in the carrying amount of an item of Property, Plant & Equipment, the remaining carrying amount of the replaced part is derecognised as required by Sri Lanka Accounting Standard - LKAS 16 on ‘Property, Plant & Equipment’.
5.6.5 Capital Work-in-Progress
These are expenses of a capital nature directly incurred in the construction of buildings, major plant and machinery and system development, awaiting capitalisation. These are stated in the Statement of Financial Position at cost less any accumulated impairment losses. Capital work-in-progress is transferred to the relevant asset when it is in the location and condition necessary for it to be capable of operating in the manner intended by management (i.e. available for use).
5.6.6 Depreciation
Depreciation is calculated to write off the cost of items of property, plant & equipment less their estimated residual values using the straight-line method over their estimated useful lives, and is recognised in profit or loss. Leased assets under finance leases are depreciated over the shorter of the lease term and their useful lives. Freehold land is not depreciated.
The estimated useful lives of the Property, Plant & Equipment of the Bank as at December 31, 2014 are as follows:
| Class of Asset | % Per Annum | Period |
| Freehold and Leasehold Buildings | 2.5 | 40 years |
| Motor Vehicles | 20 | 5 years |
| Computer Equipment | 20 | 5 years |
| Office Equipment | 20 | 5 years |
| Office Interior Work | 20 | 5 years |
| Furniture & Fittings | 10 | 10 years |
| Machinery & Equipment | 10 | 10 years |
The above rates are compatible with the rates used by all Group entities.
The above rates are also comparable with the rates applied in the previous year, except in the case of Office Interior Work which carried depreciation at the rate of 10% per annum until December 31, 2013.
The depreciation rates are determined separately for each significant part of an item of Property, Plant & Equipment and commence to depreciate when it is available for use, i.e., when it is in the location and condition necessary for it to be capable of operating in the manner intended by the management. Depreciation of an asset ceases at the earlier of the date that the asset is classified as held for sale or the date that the asset is derecognised.
All classes of Property, Plant & Equipment together with the reconciliation of carrying amounts and accumulated depreciation at the beginning and at the end of the year are given in Note 36.
5.6.7 Change in Depreciation Rate
Depreciation methods, useful lives and residual values are reassessed at each Reporting date and adjusted, if appropriate. As a result, the depreciation rate applicable for Office Interior Work was changed to 20% per annum from 10% per annum with effect from January 1, 2014. These are considered as changes in accounting estimates and hence applied prospectively.
The reason for the said change and the impact is given in Note 19.
5.6.8 Borrowing Costs
As per the Sri Lanka Accounting Standard - LKAS 23 on ‘Borrowing costs’, the Group capitalises borrowing costs that are directly attributable to the acquisition, construction or production of a qualifying asset as part of the cost of the asset. A qualifying asset is an asset which takes a substantial period of time to get ready for its intended use or sale. Other borrowing costs are recognised in the profit or loss in the period in which they occur.
5.7 Intangible Assets
The Bank’s intangible assets include the value of acquired goodwill and computer software.
5.7.1 Basis of Recognition
An intangible asset is recognised if it is probable that future economic benefits associated with the asset will flow to the entity and the cost of the asset can be measured reliably in accordance with the Sri Lanka Accounting Standard - LKAS 38 on ‘Intangible Assets’.
Intangible assets acquired separately are measured on initial recognition at cost. The cost of intangible assets acquired in a business combination is their fair value as at the date of acquisition. Following initial recognition, these assets are stated in the Statement of Financial Position at cost, less accumulated amortisation and accumulated impairment losses, if any.
5.7.2 Subsequent Expenditure
Subsequent expenditure on intangible assets is capitalised only when it increases the future economic benefits embodied in the specific asset to which it relates. All other expenditure is expensed as incurred.
5.7.3 Useful Economic Lives, Amortisation and Impairment
The useful economic lives of intangible assets are assessed to be either finite or indefinite. The Group does not possess intangible assets with indefinite useful economic lives. Useful economic lives, amortisation and impairment of finite and indefinite intangible assets are described below:
5.7.3.1 Intangible Assets with Finite Lives and Amortisation
Intangible assets with finite lives are amortised over the useful economic lives. The amortisation period and the amortisation method for an intangible asset with a finite useful life are reviewed at least at each Reporting date. Changes in the expected useful life or the expected pattern of consumption of future economic benefits embodied in the asset are accounted for by changing the amortisation period or method, as appropriate, and are treated as changes in accounting estimates, which require prospective application. The amortisation expense on intangible assets with finite lives is expensed as incurred.
5.7.3.1.1 Goodwill
Goodwill that arises on the acquisition of Subsidiaries is presented with intangible assets (Refer Note 5.1.1). Goodwill is initially measured at cost, being the excess of the aggregate of the consideration transferred and the amount recognised for non-controlling interests, and any previous interest held, over the net identifiable assets acquired and liabilities assumed.
Subsequent to initial recognition, goodwill is measured at cost less accumulated impairment losses. For the purpose of impairment testing, goodwill acquired in a business combination is, from the acquisition date, allocated to each of the Group’s cash-generating units that are expected to benefit from the combination, irrespective of whether other assets or liabilities of the acquiree are assigned to those units.
5.7.3.1.2 Computer Software
Software acquired by the Group is measured at cost less accumulated amortisation and any accumulated impairment losses.
Expenditure on internally developed software is recognised as an asset when the Group is able to demonstrate its intention and ability to complete the development and use the software in a manner that will generate future economic benefits, and can reliably measure the costs to complete the development. The capitalised costs of internally developed software include all costs directly attributable to developing the software and capitalised borrowing costs, and are amortised over its useful life. Internally developed software is stated at capitalised cost less accumulated amortisation and any accumulated impairment losses.
Subsequent expenditure on software assets is capitalised only when it increases the future economic benefits embodied in the specific asset to which it relates. All other expenditure is expensed as incurred.
5.7.3.1.3 Research and Development Costs
Research costs are expensed as incurred. Development expenditures on an individual project are recognised as an intangible asset when the Group can demonstrate:
- The technical feasibility of completing the intangible asset so that the asset will be available for use or sale
- Its intention to complete and its ability to use or sell the asset
- The asset will generate future economic benefits
- The availability of resources to complete the asset
- The ability to measure reliably the expenditure during development
- The ability to use the intangible asset generated
Following initial recognition of the development expenditure as an asset, the asset is carried at cost less any accumulated amortisation and accumulated impairment losses.
Amortisation of the asset begins when development is complete and the asset is available for use. The cost of the asset is amortised over the period of expected future benefit.
As at the Reporting date, the Group does not have development costs capitalised as an internally-generated intangible asset.
5.7.3.1.4 Amortisation of Intangible Assets
Intangible assets are amortised using the straight line method to write down the cost over its estimated useful economic lives at the rates specified below:
| Class of Asset | % Per Annum | Period |
| Computer Software | 20 | 5 years |
Above rate is in consistent with the rates used in the comparative years.
The unamortised balances of intangible assets with finite lives are reviewed for impairment whenever there is an indication for impairment and recognised in profit or loss to the extent that they are no longer probable of being recovered from the expected future benefits.
Amortisation recognised during the year in respect of intangible assets is included under the item of ‘Amortisation of Intangible Assets’ under ‘Depreciation and Amortisation’ in profit or loss.
5.7.3.2 Intangible Assets with Indefinite Useful Lives
Intangible assets with indefinite useful lives are not amortised but are tested for impairment annually either individually or at the CGU level as appropriate, when circumstances indicate that the carrying value is impaired. The useful life of an intangible asset with an indefinite life is reviewed annually to determine whether indefinite life assessment continues to be supportable. If not, the change in the useful life assessment from indefinite to finite is made on a prospective basis.
The Group does not have intangible assets with indefinite useful lives.
5.7.4 Derecognition of Intangible Assets
Intangible assets are derecognised on disposal or when no future economic benefits are expected from their use. Gains or losses arising from derecognition of an intangible asset are measured as the difference between the net disposal proceed and the carrying amount of the asset and are recognised in profit or loss.
The Group has only acquired intangible assets, a list of which with the reconciliation of carrying amounts, accumulated amortisation at the beginning and at the end of the periods is given in Note 37.
A summary of Accounting Policies applied for the Group’s Intangible Assets is as follows:
| Intangible Assets | Useful Life | Amortisation Method Used | Internally Generated/Acquired | Impairment Testing |
| Computer Software | 5 years | Amortised on a straight line basis over the useful life | Acquired | When indicators of impairment arise. The amortisation method is reviewed at each Reporting date |
| Goodwill | N/A | N/A | Acquired in a Business Combination | Annually or more frequently if events or changes in circumstances indicate that the carrying value may have been impaired. |
5.8 Impairment of Non-Financial Assets
At each Reporting date, the Group reviews the carrying amounts of its non-financial assets (other than investment properties and deferred tax assets) to determine whether there is any indication of impairment. If any such indication exists, then the asset’s recoverable amount is estimated. Goodwill is tested annually for impairment.
For impairment testing, assets are grouped together into the smallest group of assets that generates cash inflows from continuing use that is largely independent of the cash inflows of other assets or CGUs. Goodwill arising from a business combination is allocated to CGUs or groups of CGUs that are expected to benefit from the synergies of the combination.
The ‘recoverable amount’ of an asset or CGU is the greater of its value in use and its fair value less costs to sell. ‘Value in use’ is based on the estimated future cash flows, discounted to their present value using a pre-tax discount rate that reflects current market assessments of the time value of money and the risks specific to the asset or CGU.
An impairment loss is recognised if the carrying amount of an asset or CGU exceeds its recoverable amount.
The Group’s corporate assets do not generate separate cash inflows and are used by more than one CGU. Corporate assets are allocated to CGUs on a reasonable and consistent basis and tested for impairment as part of the testing of the CGUs to which the corporate assets are allocated.
Impairment losses are recognised in profit or loss. They are allocated first to reduce the carrying amount of any goodwill allocated to the CGU, and then to reduce the carrying amounts of the other assets in the CGU on a pro-rata basis.
An impairment loss in respect of goodwill is not reversed. For other assets, an impairment loss is reversed only to the extent that the asset’s carrying amount does not exceed the carrying amount that would have been determined, net of depreciation or amortisation,
if no impairment loss had been recognised.
5.9 Dividends Payable
Dividends on ordinary shares are recognised as a liability and deducted from equity when they are recommended and declared by the Board of Directors and approved by the shareholders. Interim dividends are deducted from Equity when they are declared and no longer at the discretion of the Bank.
Dividends for the year that are approved after the Reporting Date are not provided for and are disclosed as an event after the Reporting Period in accordance with the Sri Lanka Accounting Standard - LKAS 10 on ‘Events after the Reporting Period’ in Note 66.3.
5.10 Employee Benefits
5.10.1 Defined Benefit Plans (DBPs)
A Defined Benefit Plan is a post-employment benefit plan other than a Defined Contribution Plan as defined in the Sri Lanka Accounting Standard - LKAS 19 on ‘Employee Benefits’.
5.10.1.1 Defined Benefit Pension Plans
5.10.1.1.1 Description of the Plans and Employee Groups Covered
The Bank operates three types of Defined Benefit Pension Plans for its employees as described below:
(a) The Bank has an approved Pension Fund, which was established in 1992. As per the Deed of Trust, only those employees who were less than 45 years of age as at January 1, 1992 were covered by the Pension Fund in order to leave a minimum contribution for a period of 10 years before they are eligible to draw pension from the Pension Fund. Further, only the employees who joined the Bank on or before December 31, 2001, were in pensionable service of the Bank.
During 2006, the Bank offered a restructured pension scheme to convert the Defined Benefit Plan (DBP) to a Defined Contribution Plan (DCP) for the pensionable employees of the Bank and over 99% of them accepted it. As a result, the above Pension Fund now covers only those employees who did not opt for the restructured pension scheme and those employees who were covered by the Pension Fund previously but retired before the restructured pension scheme came into effect.
(b) Provision for pensions has been made for those employees who retired on or before December 31, 2001, and on whose behalf the Bank could not make contributions to the Retirement Pension Fund for more than 10 years. This liability although not funded has been provided for in full in the Financial Statements.
(c) Provision has been made in the Financial Statements for Retirement Gratuity from the first year of service for all employees who joined the Bank on or after January 1, 2002, as they are not in pensionable service of the Bank under either the DBP or DCP. However, if any of these employees resigns before retirement, the Bank is liable to pay gratuity to such employees. This liability although not funded has been provided for in full in the Financial Statements.
The Subsidiaries of the Bank do not operate Pension Funds.
The Bank’s net obligation in respect of Defined Benefit Pension Plans is calculated separately for each plan by using the Projected Unit Credit Actuarial Valuation Method, as per the Sri Lanka Accounting Standard - LKAS 19 on ‘Employee Benefits’. This method involves estimating the amount of future benefit that employees have earned in return for their service in the current and prior periods. That benefit is discounted to determine its present value as detailed in Note 47.
The past service cost is recognised as an expense on a straight-line basis over the period until the benefits become vested. If the benefits are already vested following the introduction of, or changes to, a pension plan, past service cost is recognised immediately.
5.10.1.1.2 Recognition of Actuarial Gains or Losses
Actuarial gains or losses are recognised in the OCI in the period in which they arise.
5.10.1.1.3 Recognition of Retirement Benefit Obligation
The defined benefit asset or liability comprises the present value of the defined benefit obligation, less past service cost not yet recognised and less the fair value of plan assets out of which the obligations are to be settled directly. The value of any asset is restricted to the sum of any past service cost not yet recognised and the present value of any economic benefits available in the form of refunds from the plan or reductions in the future contributions to the plan.
Amounts recognised in profit or loss as expenses on DBPs and provisions made on DBPs together with valuation methods are given in Notes 18 and 47 respectively.
5.10.2 Defined Contribution Plans (DCPs)
A Defined Contribution Plan is a post-employment plan under which an entity pays fixed contributions into a separate entity and will have no legal or constructive obligations to pay a further amount. Obligations to DCPs are recognised in the profit or loss as incurred. The Group has three such plans as explained in Notes 5.10.2.1, 5.10.2.2 and 5.10.2.3.
Amounts recognised in profit or loss as expenses on DCPs are given in Note 18.
5.10.2.1 Defined Contribution Pension Plan
As explained in Note 5.11.1.1.1(a), during 2006, the Bank restructured its pension scheme which was a DBP to a DCP. This restructured plan was offered on a voluntary basis to the eligible employees of the Bank. The scheme provides for lump sum payments instead of commuted/monthly pensions to the eligible employees at the point of their separation, in return for surrendering their pension rights. The lump sum offered consisted of a past service package and a future service package. The shortfall on account of the past service package in excess of the funds available in the Pension Fund was borne by the Bank in 2006.
The future service package includes monthly contributions to be made by the Bank for the employees who accepted the offer, to be made during their remaining period of service, at predetermined contribution rates to be applied on their salaries, which are estimated to increase for this purpose at 10% p.a. based on the salary levels that prevailed as at the date of implementation of this scheme. In addition, interest to be earned on the assets of the DCP is also allocated to the employees who opted for the restructured scheme.
The assets of this Fund are held separately from those of the Bank and are independently administered by the Trustees as per the provisions of the Trust Deed.
5.10.2.2 Employees’ Provident Fund
The Bank and employees contribute to the approved Private Provident Fund at 12% and 8% respectively, on the salaries of each employee. Other entities of the Group and their employees contribute at the same percentages as above to the Employees’ Provident Fund managed by the Central Bank of Sri Lanka.
5.10.2.3 Employees’ Trust Fund
The Bank and other entities of the Group contribute at the rate of 3% of the salaries of each employee to the Employees’ Trust Fund managed by the Central Bank of Sri Lanka.
5.10.3 Other Long-Term Employee Benefits
The Group’s net obligation in respect of long term employee benefits other than pension plans is the amount of future benefits that employees have earned in return for their service in the current and prior periods. That benefit is discounted to determine its present value, and the fair value of any related assets is deducted. The discount rate used as the yield at the Reporting date was the current market rate that has been extrapolated to reflect long-term rate of discount based on market rates of interest on short term corporate/government bonds and anticipated long term rate of inflation. The calculation is performed using the Projected Unit Credit Method. Any actuarial gains and losses are recognised in profit or loss in the period in which they arise.
The Group does not have any other long term employee benefit plans.
5.10.4 Terminal Benefits
Termination benefits are expensed at the earlier of when the Group can no longer withdraw the offer of those benefits and when the Group recognises costs for a restructuring. If benefits are not expected to be wholly settled within 12 months of the Reporting date, then they are discounted.
5.10.5 Short Term Employee Benefits
Short term employee benefits are expensed as the related service is provided. A liability is recognised for the amount expected to be paid if the Group has a present legal or constructive obligation to pay this amount as a result of past service provided by the employee and the obligation can be estimated reliably.
5.10.6 Equity Compensation Benefits
Share-based payment arrangements in which the Group receives services as consideration for its own equity instruments are accounted for as equity-settled share-based payment transactions, regardless of how the equity instruments are obtained by the Group. Senior Executives Employees of the Group receive remuneration in the form of share-based payment transactions, whereby employees render services as consideration for equity instruments (equity-settled transactions). The Group does not operate any cash-settled share-based payment transactions.
The Group applies the requirements of the Sri Lanka Accounting Standard - SLFRS 2 on ‘Share-Based Payment’ in accounting for equity settled share-based payment transactions, if any, that were granted after January 1, 2012 and had not vested at the same date. As per the Sri Lanka Accounting Standard - SLFRS 2 on ‘Share-based Payment’, on the grant date fair value of equity-settled share-based payment awards (i.e., share options) granted to employees is recognised as personnel expense, with a corresponding increase in equity, over the period in which the employees unconditionally become entitled to the awards. The amount recognised as an expense is adjusted to reflect the number of share awards for which the related service and non-market performance vesting conditions are expected to be met such that the amount ultimately recognised as an expense is based on the number of share awards that do meet the related service and non-market performance conditions at the vesting date. For share-based payment awards with non-vesting conditions, the grant date fair value of the share-based payment is measured to reflect such conditions and there is no true-up for differences between expected and actual outcomes.
As the Group did not grant any share-based payment transaction after January 01, 2012, it did not apply the above accounting treatment during the year and the proceeds received by the Group in consideration for the shares issued (in connection with the Employee Share Option Schemes granted prior to January 01, 2012) were accounted for as Stated Capital within equity.
The details of Employee Share Option Plans are given in Note 50.2.
The dilutive effect of outstanding options is reflected as additional share dilution in the computation of diluted earnings per share as disclosed in Note 22.2.
5.11 Other Liabilities
Other liabilities include provisions made on account of interest, fees and expenses, gratuity/pensions, leave encashment and other provisions. These liabilities are recorded at amounts expected to be payable at the Reporting date.
Details of ‘Other Liabilities’ are given in Note 47.
5.12 Provisions
A provision is recognised if, as a result of a past event, the Group has a present legal or constructive obligation that can be estimated reliably, and it is probable that an outflow of economic benefits will be required to settle the obligation. Provisions are determined by discounting the expected future cash flows at a pre-tax rate that reflects current market assessments of the time value of money and the risks specific to the liability. The unwinding of the discount is recognised in ‘Interest Expense’ in profit or loss.
5.13 Restructuring
Provision for restructuring is recognised when the Group has approved a detailed and formal restructuring plan, and the restructuring either has commenced or has been announced publicly. Future operating losses are not provided for.
The Group does not have any provision for restructuring as at the Reporting date.
5.14 Onerous Contracts
A provision for onerous contracts is recognised when the expected benefits to be derived by the Group from a contract are lower than the unavoidable cost of meeting its obligations under the contract. The provision is measured at the present value of the lower of the expected cost of terminating the contract and the expected net cost of continuing with the contract.
The Group does not have any onerous contracts as at the Reporting date.
5.15 Financial Guarantees and Loan Commitments
‘Financial guarantees’ are contracts that require the Group to make specified payments to reimburse the holder for a loss that it incurs because a specified debtor fails to make payment when it is due in accordance with the terms of a debt instrument. ‘Loan commitments’ are firm commitments to provide credit under pre-specified terms and conditions.
Liabilities arising from financial guarantees or commitments to provide a loan at a below-market interest rate are initially measured at fair value and the initial fair value is amortised over the life of the guarantee or the commitment. The liability is subsequently carried at the higher of this amortised amount and the present value of any expected payment to settle the liability when a payment under the contract has become probable. Financial guarantees and commitments to provide a loan at a below-market interest rate are included within other liabilities.
5.16 Commitments
All discernible risks are accounted for in determining the amount of known liabilities as explained in Note 5.11 above.
Details of the commitments are given in Notes 55.2 and 55.3 to the Financial Statements.
5.17 Contingent Liabilities and Commitments
Contingent liabilities are possible obligations whose existence will be confirmed only by uncertain future events or present obligations where the transfer of economic benefit is not probable or cannot be readily measured as defined in the Sri Lanka Accounting Standard - LKAS 37 on ‘Provisions, Contingent Liabilities and Contingent Assets’.
To meet the financial needs of customers, the Bank enters into various irrevocable commitments and contingent liabilities. These consist of financial guarantees, letters of credit and other undrawn commitments to lend. Letters of credit and guarantees commit the Bank to make payments on behalf of customers in the event of a specific act, generally related to the import or export of goods. Guarantees and standby letters of credit carry a similar credit risk to loans.
Contingent liabilities are not recognised in the Statement of Financial Position but are disclosed unless its occurrence is remote.
Operating lease commitments of the Group (as a lessor and as a lessee) form part of commitments and pending legal claims against the Group form part of contingencies.
Even though these obligations may not be recognised on the Statement of Financial Position, they do contain credit risk and are therefore part of the overall risk of the Bank as disclosed in Note 55.1.
5.17.1 Legal Claims
Litigation is a common occurrence in the banking industry due to the nature of the business undertaken. The Bank has formal controls and policies for managing legal claims. Once professional advice has been obtained and the amount of loss reasonably estimated, the Bank makes adjustments to account for any adverse effects which the claims may have on its financial standing. At the Reporting date the Group had several unresolved legal claims. The significant unresolved legal claims against the Bank for which legal advisor of the Bank advised as the loss is possible, but not probable, that the action will succeed. Accordingly, no provision for any claims has been made in these Financial Statements.
A detailed list of significant pending litigations against the Group is given in Note 57.
5.17.2 Contingent Liabilities, Commitments of Other Group Entities
The Bank’s share of any contingencies and capital commitments of a Subsidiary or an Associate for which the Bank is also liable severally or otherwise is included with appropriate disclosures.
Details of the Commitments and contingencies of other Group entities are given in Note 55.4.
5.18 Stated Capital and Reserves
5.18.1 Debt Vs Equity
The Group classifies capital instruments as financial liabilities or equity instruments in accordance with the substance of the contractual terms of the instruments. Distributions thereon are recognised as interest or dividend depending on the debt or equity classification.
5.18.2 Share Issue Costs
Incremental costs that are directly attributable to the issue of an equity instrument are deducted from the initial measurement of the equity instruments.
5.18.3 Reserves
Several statutory and voluntary reserves are maintained by the Group in order to meet various legal and operational requirements. The details of these reserves including the nature and purpose of maintaining them are given in Notes 51, 52 and 53.
5.19 Earnings Per Share (EPS)
The Group computes basic and diluted EPS data for its ordinary shares. Basic EPS is calculated by dividing the profit or loss that is attributable to ordinary shareholders of the Group/Bank by the weighted-average number of ordinary shares outstanding during the period. Diluted EPS is determined by adjusting the profit or loss that is attributable to ordinary shareholders of the Group/Bank and the weighted-average number of ordinary shares outstanding for the effects of all dilutive potential ordinary shares, which comprise share options granted to employees.
Details of Basic and Diluted EPS are given in Note 22.
5.20 Operating Segments
An operating segment is a component of the Group that engages in business activities from which it may earn revenues and incur expenses, including revenues and expenses that relate to transactions with any of the Group’s other components, whose operating results are reviewed regularly by the Corporate Management Team headed by the Managing Director/Chief Executive Officer (being the chief operating decision-maker) to make decisions about resources allocated to each segment and assess its performance, and for which discrete financial information is available.
The Group has five strategic divisions which are reportable segments, namely:
| Operating Segment | Types of Products and Services Offered |
| Personal Banking | Refer ‘Bank’s Products and Services Portfolio’ in Our Business Model |
| Corporate Banking | |
| International Operations | |
| Investment Banking | |
| Dealing and Treasury |
Segment performance is evaluated based on operating profits or losses which, in certain respects, are measured differently from operating profits or losses in the Consolidated Financial Statements. Income taxes are managed on a group basis and are not allocated to operating segments.
Segment results that are reported to the Chief Executive Officer (being the chief operating decision-maker) include items that are directly attributable to a segment as well as those that can be allocated on a reasonable basis. Unallocated items comprise mainly corporate assets (primarily the Bank’s head office), head office expenses and tax assets and liabilities.
Interest income is reported on a net basis as management primarily relies on net interest income as a performance measure and not the gross income and expense.
Inter-segment transactions are accounted for at fair market prices charged to inter-bank counterparts for similar services on an arm’s length basis. Such transfers are eliminated on consolidation.
No revenue from transactions with a single external customer or counterparty amounted to 10% or more of the Bank’s total revenue in 2014 or 2013.
Detailed information on the results of each reportable segment as required by the Sri Lanka Accounting Standard - SLFRS 8 on ‘Operating Segments’ is provided in Note 59.
5.21 Fiduciary Assets
The Bank provides trust and other fiduciary services that result in the holding or investing of assets on behalf of its clients. Assets held in a fiduciary capacity are not reported in these Financial Statements as they do not belong to the Bank.
6. Significant Accounting Policies - Recognition of Income and Expenses
Revenue is recognised to the extent that it is probable that the economic benefits will flow to the Group and the revenue can be reliably measured. The following specific recognition criteria must also be met before revenue is recognised:
6.1 Interest Income and Expense
Interest income and expense are recognised in profit or loss using the EIR method. The ‘effective interest rate’ is the rate that exactly discounts the estimated future cash payments and receipts through the expected life of the financial asset or financial liability (or, where appropriate, a shorter period) to the carrying amount of the financial asset or financial liability. When calculating the effective interest rate, the Group estimates future cash flows considering all contractual terms of the financial instrument, but not future credit losses.
The calculation of the EIR includes transaction costs and fees and points paid or received that are an integral part of the EIR. Transaction costs include incremental costs that are directly attributable to the acquisition or issue of a financial asset or financial liability.
Interest income and expense presented in the Income Statement include:
- interest on financial assets and financial liabilities measured at amortised cost calculated on an EIR method;
- interest income and expense on financial assets and liabilities held-for-trading calculated on an EIR method;
- interest on available-for-sale investment securities calculated on an EIR method;
- the effective portion of fair value changes in qualifying hedging derivatives designated in cash flow hedges of variability in interest cash flows, in the same period as the hedged cash flows affect interest income/expense, if any; and
- the effective portion of fair value changes in qualifying hedging derivatives designated in fair value hedges of interest rate risk, if any.
6.2 Fees and Commission Income and Expense
Fees and commission income and expense that are integral to the EIR on a financial asset or liability are included in the measurement of the EIR.
Other fees and commission income, including account servicing fees, investment management fees, sales commission, placement fees and syndication fees, are recognised as the related services are performed. If a loan commitment is not expected to result in the drawdown of a loan, then the related loan commitment fees are recognised on a straight-line basis over the commitment period.
Other fees and commission expense relate mainly to transaction and service fees, which are expensed as the services are received.
6.3 Net Gains/(Losses) from Trading
‘Net gains/(losses) from trading’ comprise gains less losses related to trading assets and liabilities, and include all realised and unrealised fair value changes, dividends and foreign exchange differences.
6.4 Dividend Income
Dividend income is recognised when the right to receive income is established. Usually, this is the ex-dividend date for quoted equity securities. Dividends are presented in Net gains/(losses) from trading, or Net gains/(losses) from other financial investments based on the underlying classification of the equity investment.
6.5 Lease Income
In terms of the provisions of the Sri Lanka Accounting Standard - LKAS 17 on ‘Leases’, the recognition of income on finance leases is accounted for based on a pattern reflecting a constant periodic rate of return on capital outstanding.
The excess of aggregate lease rentals receivable over the cost of the leased assets constitutes the total unearned lease income at the commencement of a lease. The unearned lease income included in the lease rentals receivable is recognised in profit or loss over the term of the lease commencing from the month in which the lease is executed using EIR.
6.6 Lease Payments
Payments made under operating leases are recognised in profit or loss on a straight-line basis over the term of the lease. Lease incentives received are recognised as an integral part of the total lease expense, over the term of the lease.
Minimum lease payments made under finance leases are apportioned between the finance expense and the reduction of the outstanding liability. The finance expense is allocated to each period during the lease term so as to produce a constant periodic rate of interest expense on the remaining balance of the liability.
Contingent lease payments are accounted for by revising the minimum lease payments over the remaining term of the lease when the lease adjustment is confirmed.
6.7 Rental Income and Expenses
Rental income and expense are recognised in the profit or loss on an accrual basis.
7. Significant Accounting Policies - Income Tax Expense
Income tax expense comprises current and deferred tax. Income tax expense is recognised in the Income Statement except to the extent it relates to items recognised directly in Equity or in OCI, in which case it is recognised in equity or in OCI.
7.1 Current Taxation
Current tax’ comprises the expected tax payable or receivable on the taxable income or loss for the year and any adjustment to the tax payable or receivable in respect of previous years. It is measured using tax rates enacted or substantively enacted, at the Reporting date.
Accordingly, provision for taxation is made on the basis of the accounting profit for the year as adjusted for taxation purposes in accordance with the provisions of the Inland Revenue Act No. 10 of 2006 and amendments thereto, at the rates specified in Note 21.1. This Note also includes the major components of tax expense, the effective tax rates and a reconciliation between the profit before tax and tax expense as required by the Sri Lanka Accounting Standard - LKAS 12 on ‘Income Taxes’.
Provision for taxation on the overseas operations is made on the basis of the accounting profit for the year as adjusted for taxation purposes in accordance with the provisions of the relevant statutes in those countries using the tax rates enacted or substantively enacted, at the Reporting date.
7.2 Deferred Taxation
Deferred tax is recognised in respect of temporary differences between the carrying amounts of assets and liabilities for financial reporting purposes and the amounts used for taxation purposes. Deferred tax is not recognised for:
- temporary differences on the initial recognition of assets or liabilities in a transaction that is not a business combination and that affects neither accounting nor taxable profit or loss;
- temporary differences related to investments in subsidiaries to the extent that it is probable that they will not reverse in the foreseeable future; and
- taxable temporary differences arising on the initial recognition of goodwill.
Deferred tax assets are recognised for unused tax losses, unused tax credits and deductible temporary differences to the extent that it is probable that future taxable profits will be available against which they can be used. Deferred tax assets are reviewed at each Reporting date and are reduced to the extent that it is no longer probable that the related tax benefit will be realised.
Unrecognised deferred tax assets are reassessed at each Reporting date and recognised to the extent that it has become probable that future taxable profits will be available against which they can be used.
Deferred tax is measured at the tax rates that are expected to be applied to temporary differences when they reverse, using tax rates enacted or substantively enacted at the Reporting date.
The measurement of deferred tax reflects the tax consequences that would follow the manner in which the Group expects, at the Reporting date, to recover or settle the carrying amount of its assets and liabilities.
Additional taxes that arise from the distribution of dividends by the Group are recognised at the same time as the liability to pay the related dividend is recognised. These amounts are generally recognised in profit or loss because they generally relate to income arising from transactions that were originally recognised in profit or loss.
Details of Deferred Tax Assets and Liabilities are given in Note 45.
7.3 Tax Exposures
In determining the amount of current and deferred tax, the Group considers the impact of tax exposures, including whether additional taxes and interest may be due. This assessment relies on estimates and assumptions and may involve a series of judgments about future events. New information may become available that causes the Group to change its judgment regarding the adequacy of existing tax liabilities. Such changes to tax liabilities would impact tax expense in the period in which such a determination is made.
7.4 Crop Insurance Levy (CIL)
As per the provisions of the Section 14 of the Finance Act No. 12 of 2013, the CIL was introduced with effect from April 01, 2013 and is payable to the National Insurance Trust Fund. Currently, the CIL is payable at 1% of the profit after tax.
7.5 Withholding Tax on Dividends Distributed by the Bank, Subsidiaries and Associates
7.5.1 Withholding Tax on Dividends Distributed by the Bank
Withholding tax that arises from the distribution of dividends by the Bank is recognised at the time the liability to pay the related dividend is recognised.
7.5.2 Withholding Tax on Dividends Distributed by the Subsidiaries and Associates
Dividends received by the Bank from its Subsidiaries and Associates, have attracted a 10% deduction at source.
7.6 Economic Service Charge (ESC)
As per the provisions of the Finance Act No. 11 of 2004, and amendments thereto, the ESC was introduced with effect from April 01, 2004. Currently, the ESC is payable at 0.25% on ‘Exempt Turnover’ and is deductible from the income tax payments. Unclaimed ESC, if any, can be carried forward and set-off against the income tax payable in the five subsequent years.
7.7 Value Added Tax on Financial Services
The value base for the computation of value added tax on financial services is calculated by adjusting the depreciation computed on rates prescribed by the Department of Inland Revenue to the accounting profit before Income Tax and emoluments payable. Emoluments payable include benefits in money and not in money including contribution or provision relating to terminal benefits.
7.8 Nation Building Tax on Financial Services (NBT)
With effect from January 01, 2014, NBT of 2% was introduced on supply of financial services via an amendment to the NBT Act No. 09, of 2009. NBT is chargeable on the same base used for calculation of VAT on financial services as explained in Note 7.7 above.
The amount of Value Added Tax and NBT charged in determining the profit or loss for the period is given in the Income Statement.
8. Statement of Cash Flows
The Statement of Cash Flows has been prepared by using the ‘Indirect Method’ of preparing cash flows in accordance with the Sri Lanka Accounting Standard - LKAS 7 on ‘Statement of Cash Flows’. Cash and cash equivalents comprise of short term, highly liquid investments that are readily convertible to known amounts of cash and are subject to an insignificant risk of changes in value. Cash and cash equivalents as referred to in the Statement of Cash Flows are comprised of those items as explained in Note 26.
The Statement of Cash Flows is given in Financial Reports section.
9. New Accounting Standards Applied Effective from January 01, 2014
| New Accounting Standard | Objective of the Accounting Standard |
| SLFRS 10 - ‘Consolidated Financial Statements’ | Establishing principles for the preparation and presentation of Consolidated Financial Statements when an entity controls one or more other entities. |
| SLFRS 12 - ‘Disclosure of Interests in Other Entities’ | Requiring the entity to disclose information that enables users of its Financial Statements to evaluate the nature and risks associated with its interests in other entities; and the effects of those interests on its financial performance, financial position, and cash flows. |
| SLFRS 13 - ‘Fair Value Measurement’ | Defining fair value in a single SLFRS, a framework for measuring fair value and disclosures about fair value measurements. |
10. New Accounting Standards Issued But Not Yet Effective
A number of new standards and amendments to standards which have been issued but not yet effective as at the Reporting date have not been applied in preparing these Consolidated Financial Statements. Accordingly, the following Accounting Standards have not been applied in preparing these Financial Statements and the Group plans to apply these standards on the respective effective dates.
| Accounting Standard | Summary of the Requirements | Possible Impact on Consolidated Financial Statements |
| SLFRS 9 - ‘Financial Instruments’ | SLFRS 9, issued in 2014, replaces the existing guidance in LKAS 39 - Financial Instruments: Recognition and Measurement. SLFRS 9 includes revised guidance on the classification and measurement of financial instruments, including a new expected credit loss model for calculating impairment on financial assets, and the new general hedge accounting requirements. It also carries forward the guidance on recognition and derecognition of financial instruments from LKAS 39.
Effective date of SLFRS 9 has been deferred till January 01, 2018. |
The Group/Bank is assessing the potential impact on its Consolidated Financial Statements resulting from the application of SLFRS 9.
Given the nature of the Group/Bank’s operations, this standard is expected to have a pervasive impact on the Group’s Financial Statements. In particular, calculation of impairment of financial instruments on an expected credit loss model is expected to result in an increase in the overall level of impairment allowances. |
| SLFRS 15 - ‘Revenue from Contracts with Customers’ | SLFRS 15 establishes a comprehensive framework for determining whether, how much and when revenue is recognised. It replaces existing revenue recognition guidance, including LKAS 18 on ‘Revenue’, and LKAS 11 on ‘Construction Contracts’.
SLFRS 15 is effective for annual reporting periods beginning on or after January 01, 2017. |
The Group/Bank is assessing the potential impact on its Consolidated Financial Statements resulting from the application of SLFRS 15. |
The following new Accounting Standards are not expected to have an impact on the Financial Statements of the Group.
- Agriculture: Bearer Plants (Amendments to LKAS 16 on ‘Property, Plant & Equipment’ and LKAS 41 on ‘Agriculture’). Effective date January 01, 2016
- Regulatory Deferral Assets (SLFRS 14) - Effective date January 01, 2016
11. Gross Income
| GROUP | BANK | |||
| For the year ended December 31, | 2014 | 2013 | 2014 | 2013 |
| Rs. ’000 | Rs. ’000 | Rs. ’000 | Rs. ’000 | |
| Interest income [Refer Note 12.1] |
61,932,876 | 62,754,147 | 61,832,018 | 62,763,644 |
| Fees and commission income [Refer Note 13.1] |
5,613,684 | 4,880,093 | 5,592,744 | 4,876,517 |
| Net gains/(losses) from trading [Refer Note 14] |
(305,492) | (1,625,926) | (305,492) | (1,625,926) |
| Net gains/(losses) from financial investments [Refer Note 15] |
2,272,575 | 1,349,517 | 2,272,575 | 1,349,517 |
| Other income (net) [Refer Note 16] |
5,024,171 | 6,346,685 | 5,049,995 | 6,372,515 |
| Total | 74,537,814 | 73,704,516 | 74,441,840 | 73,736,267 |
12. Net Interest Income
(*) For better presentation and to be comparable with the current year’s classification, the Group has reclassified interest concessions granted to customers under ‘Impairment charges for loans and other losses’. Until December 31, 2013, this amount had been netted off against ‘Interest income on loans and receivables to other customers’.
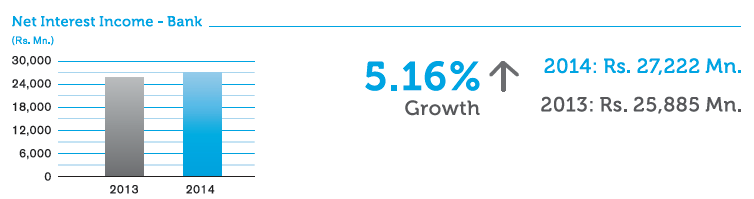
12.3 Net Interest Income from Government Securities
Interest Income and Interest Expenses on Government Securities given in the Notes 12.3 (a) and 12.3 (b) below have been extracted from Interest Income and Interest Expenses given in Notes 12.1 and 12.2, respectively and disclosed separately, as required by the Guidelines issued by the Central Bank of Sri Lanka.
| GROUP | BANK | |||
| For the year ended December 31, | 2014 | 2013 | 2014 | 2013 |
| Rs. ’000 | Rs. ’000 | Rs. ’000 | Rs. ’000 | |
12.3 (a) Net Interest Income from Sri Lanka Government Securities |
||||
| Interest income | 18,119,028 | 14,159,223 | 18,118,582 | 14,159,223 |
| Less: Interest expenses | 5,204,286 | 3,187,878 | 5,217,870 | 3,205,500 |
| Sub total | 12,914,742 | 10,971,345 | 12,900,712 | 10,953,723 |
Notional tax credit on secondary market transactions
As per the Section 137 of the Inland Revenue Act No. 10 of 2006 and amendments thereto, Net Interest Income of the Group/Bank derived from secondary market transactions in Government securities, Treasury Bills or Treasury Bonds (Interest income accrued or received on outright or reverse repurchase transactions on Government Securities, Treasury Bills or Bonds less interest expenses on repurchase transactions with such Government Securities, Treasury Bills or Bonds from which such interest income was earned) for the period January 1, 2014 to December 31, 2014 has been grossed up by Rs. 1,080.686 Mn. (2013 - Rs. 905.407 Mn.) and Rs. 1,079.038 Mn. (2013 - Rs. 903.649 Mn.) by the Group and the Bank respectively as the notional tax credit, consequent to the interest income on above instruments being subjected to withholding tax.
| GROUP | BANK | |||
| For the year ended December 31, | 2014 | 2013 | 2014 | 2013 |
| Rs. ’000 | Rs. ’000 | Rs. ’000 | Rs. ’000 | |
12.3. (b) Net Interest Income from Bangladesh Government Securities |
||||
| Interest income | 1,545,740 | 1,121,953 | 1,545,740 | 1,121,953 |
| Less: Interest expenses | 12,694 | 7,875 | 12,694 | 7,875 |
| Sub total | 1,533,046 | 1,114,078 | 1,533,046 | 1,114,078 |
13. Net Fees and Commission Income
| GROUP | BANK | |||
| For the year ended December 31, | 2014 | 2013 | 2014 | 2013 |
| Rs. ’000 | Rs. ’000 | Rs. ’000 | Rs. ’000 | |
| Fees and commission income [Refer Note 13.1] |
5,613,684 | 4,880,093 | 5,592,744 | 4,876,517 |
| Less: Fees and commission expenses [Refer Note 13.2] |
764,322 | 627,235 | 761,527 | 627,235 |
| Net fees and commission income | 4,849,362 | 4,252,858 | 4,831,217 | 4,249,282 |
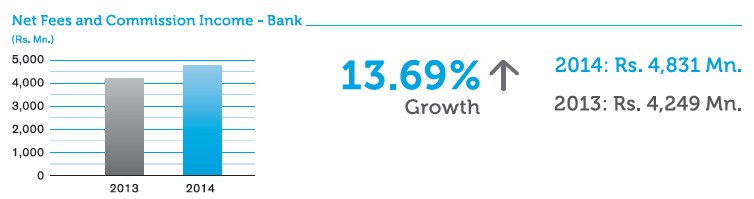
14. Net Gains/(Losses) from Trading
| GROUP | BANK | |||
| For the year ended December 31, | 2014 | 2013 | 2014 | 2013 |
| Rs. ’000 | Rs. ’000 | Rs. ’000 | Rs. ’000 | |
| Foreign exchange | ||||
| From banks | – | – | – | – |
| From other customers | (709,249) | (1,866,386) | (709,249) | (1,866,386) |
| Interest rates | ||||
| Net mark-to-market gains/(losses) | 28,374 | 83,268 | 28,374 | 83,268 |
| Net capital gains/(losses) | 256,611 | 131,488 | 256,611 | 131,488 |
| Equities | ||||
| Net mark-to-market gains/(losses) | 79,190 | 2,225 | 79,190 | 2,225 |
| Net capital gains/(losses) | 30,705 | 13,644 | 30,705 | 13,644 |
| Dividend income from shares in the trading portfolio | 8,877 | 9,835 | 8,877 | 9,835 |
| Total | (305,492) | (1,625,926) | (305,492) | (1,625,926) |
15. Net Gains/(Losses) from Financial Investments
| GROUP | BANK | |||
| For the year ended December 31, | 2014 | 2013 | 2014 | 2013 |
| Rs. ’000 | Rs. ’000 | Rs. ’000 | Rs. ’000 | |
| Financial investments – Available-for-sale | ||||
| Government securities | 2,197,337 | 544,903 | 2,197,337 | 544,903 |
| Equities | 31,782 | 804,614 | 31,782 | 804,614 |
| Net capital gains/(losses) | – | 787,362 | – | 787,362 |
| Dividend income | 31,782 | 17,252 | 31,782 | 17,252 |
| Loans and receivables | ||||
| Government securities | 41,523 | – | 41,523 | – |
| Other securities | 1,933 | – | 1,933 | – |
| Total | 2,272,575 | 1,349,517 | 2,272,575 | 1,349,517 |
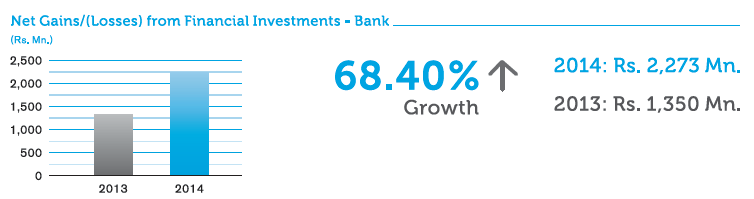
16. Other Income (Net)
| GROUP | BANK | |||
| For the year ended December 31, | 2014 | 2013 | 2014 | 2013 |
| Rs. ’000 | Rs. ’000 | Rs. ’000 | Rs. ’000 | |
| Gains/(losses) on sale of property, plant & equipment | (2,144) | 11,115 | (4,916) | 233 |
| Gains/(losses) on revaluation of foreign exchange | 2,190,423 | 3,862,003 | 2,190,423 | 3,862,435 |
| Recoveries of loans written off and provision reversals | 2,719,334 | 2,228,281 | 2,719,334 | 2,228,281 |
| Dividend income from subsidiaries | – | – | 70,383 | 70,451 |
| Dividend income from associates | 851 | 2,691 | – | 2,079 |
| Rental and other income | 116,558 | 245,286 | 74,771 | 209,036 |
| Less: Dividends received from associates transferred to investment account | (851) | (2,691) | – | – |
| Total | 5,024,171 | 6,346,685 | 5,049,995 | 6,372,515 |
17. Impairment Charges for Loans and Other Losses
| GROUP | BANK | |||
| For the year ended December 31, | 2014 | 2013 | 2014 | 2013 |
| Rs. ’000 | Rs. ’000 | Rs. ’000 | Rs. ’000 | |
| Loans and receivables | ||||
| To banks [Refer Note 31] | – | – | – | – |
| To other customers | 4,898,249 | 5,177,019 | 4,879,606 | 5,177,019 |
| Charge/(write back) to the Income Statement - Individual Impairment(*) [Refer Note 32.2] |
390,003 | 1,070,253 | 390,003 | 1,070,253 |
| Charge/(write back) to the Income Statement - Collective Impairment(*) [Refer Note 32.2] |
4,480,932 | 4,007,742 | 4,462,289 | 4,007,742 |
| Direct write-offs | 27,314 | 99,024 | 27,314 | 99,024 |
| Investments in subsidiaries [Refer Note 34.1] | – | – | 28,787 | 14,184 |
| Due from subsidiaries | – | – | 10,362 | 12,809 |
| Total | 4,898,249 | 5,177,019 | 4,918,755 | 5,204,012 |
(*) For better presentation and to be comparable with the current year’s classification, the Group has separately identified provision reversals o/a loans and advances which were subjected to both individual and collective impairment under respective line items namely, ‘Charge/(write back) to the Income Statement from individual/Collective Impairment’. Until December 31, 2013, this amount had been netted off against ‘Charge/(write back) to the Income Statement on Individual Impairment’. Further, the Group has reclassified interest concessions granted to customers under ‘Impairment charges for loans and other losses’. Until December 31, 2013, this amount had been netted off against - ‘Interest income on loans and receivables to other customers’.
18. Personnel Expenses
| GROUP | BANK | |||
| For the year ended December 31, | 2014 | 2013 | 2014 | 2013 |
| Rs. ’000 | Rs. ’000 | Rs. ’000 | Rs. ’000 | |
| Salary and bonus [Refer Note 18.1] | 6,866,200 | 6,125,863 | 6,828,987 | 6,108,648 |
| Pension Costs [Refer Note 18.1] | ||||
| Contributions to defined contribution/benefit plans - Funded schemes | 984,213 | 904,919 | 980,821 | 900,844 |
| Contributions to defined benefit plans - Unfunded schemes [Refer Notes 47.1 (b) and 47.2 (b)] |
164,438 | 165,791 | 157,687 | 160,113 |
| Others [Refer Note 18.2] | 941,472 | 1,024,692 | 935,553 | 1,016,600 |
| Total | 8,956,323 | 8,221,265 | 8,903,048 | 8,186,205 |
18.1 Salary, Bonus and Pension Costs
Salary, bonus and contributions to defined contribution/benefit plans, reported above also include amounts paid to and contribution made on behalf of Executive Directors.
18.2 Others
This includes expenses such as overtime payments, medical and hospitalisation charges, expenses incurred on staff training/recruitment and staff welfare activities, etc.
19. Depreciation and Amortisation
| GROUP | BANK | |||
| For the year ended December 31, | 2014 | 2013 | 2014 | 2013 |
| Rs. ’000 | Rs. ’000 | Rs. ’000 | Rs. ’000 | |
| Depreciation of property, plant & equipment [Refer Note 36] | 1,087,175 | 717,583 | 1,026,730 | 786,024 |
| Amortisation of intangible assets [Refer Note 37] |
173,373 | 149,347 | 172,874 | 149,291 |
| Amortisation of leasehold property [Refer Note 38] |
1,452 | 1,452 | 942 | 942 |
| Total | 1,262,000 | 868,382 | 1,200,546 | 936,257 |
With effect from January 01, 2014, the Bank changed the depreciation rate used for Office Interior Work to 20% per annum from the 10% per annum earlier with the objective of better reflecting the expected periodic consumption pattern of the said asset category resulting from the assessment of the expected future benefits associated. As a result, the depreciation expense of the Bank and the Group for the year ended December 31, 2014 increased by Rs. 210.172 Mn.
20. Other Operating Expenses
| GROUP | BANK | |||
| For the year ended December 31, | 2014 | 2013 | 2014 | 2013 |
| Rs. ’000 | Rs. ’000 | Rs. ’000 | Rs. ’000 | |
| Directors’ emoluments [Refer Note 20.1] | 30,077 | 24,453 | 27,463 | 23,058 |
| Auditors’ remuneration | 24,589 | 22,856 | 21,525 | 19,890 |
| Audit fees and expenses | 11,502 | 10,823 | 9,032 | 8,596 |
| Audit related fees and expenses | 7,792 | 6,654 | 7,570 | 6,405 |
| Non-audit fees and expenses | 5,295 | 5,379 | 4,923 | 4,889 |
| Professional and legal expenses | 252,438 | 251,068 | 315,388 | 305,450 |
| Deposit insurance premium to the Central Bank of Sri Lanka | 433,296 | 443,179 | 433,296 | 443,179 |
| Donations, including contribution made to the CSR Trust Fund | 54,583 | 51,319 | 54,583 | 51,319 |
| Establishment expenses | 1,976,178 | 1,838,325 | 2,054,074 | 1,919,681 |
| Maintenance of property, plant & equipment | 755,013 | 790,373 | 865,063 | 864,533 |
| Office administration expenses | 1,975,789 | 1,879,251 | 1,851,186 | 1,797,220 |
| Total | 5,501,963 | 5,300,824 | 5,622,578 | 5,424,330 |
20.1 Directors’ Emoluments
Directors’ emoluments represent the fees paid to both Executive and Non-Executive Directors of the Group.
21. Income Tax Expense
21.1 Entity-wise Breakup of the Income Tax Expense in the Income Statement is as follows:
| GROUP | BANK | |||
| For the year ended December 31, | 2014 | 2013 | 2014 | 2013 |
| Rs. ’000 | Rs. ’000 | Rs. ’000 | Rs. ’000 | |
| Bank Current Year Tax Expense |
||||
| Current year Income tax expense of Domestic Banking Unit | 2,964,140 | 2,869,752 | 2,964,140 | 2,869,752 |
| Current year Income tax expense of Off-shore Banking Centre | 282,603 | 191,760 | 282,603 | 191,760 |
| Current year Income tax expense of Bangladesh operation | 1,169,581 | 960,937 | 1,169,581 | 960,937 |
| Withholding tax on dividends paid | 7,789 | 8,285 | 7,789 | 8,285 |
| Sub total | 4,424,113 | 4,030,734 | 4,424,113 | 4,030,734 |
| Prior years | ||||
| Under/(over) provision of taxes in respect of prior years [Refer Note 44 - Bank] | 11,041 | (169,789) | 11,041 | (169,789) |
| 4,435,154 | 3,860,945 | 4,435,154 | 3,860,945 | |
| Deferred Tax Expense | ||||
| Effect of change in tax rates | – | – | – | – |
| Origination and reversal of temporary differences [Refer Note 45.1 - Bank] | 120,881 | 204,063 | 120,881 | 204,063 |
| 4,556,035 | 4,065,008 | 4,556,035 | 4,065,008 | |
| Subsidiaries | ||||
| Income tax expense of Commercial Development Company PLC | 36,332 | 46,266 | – | – |
| Income tax expense of ONEzero Co. Ltd. | 11,774 | 6,187 | – | – |
| Income tax expense of Indra Finance Ltd. | 12,983 | – | – | – |
| Total | 4,617,124 | 4,117,461 | 4,556,035 | 4,065,008 |
| Effective tax rate (including deferred tax) | – | – | 28.95% | 28.01% |
| Effective tax rate (excluding deferred tax) | – | – | 28.18% | 26.61% |
The income tax for 2014 and 2013 of the Bank and its subsidiaries have been provided on the taxable income at the rates shown below:
| 2014 | 2013 | |
| % | % | |
| Domestic operations of the Bank | 28 | 28 |
| Off-shore banking operation of the Bank | 28 | 28 |
| Bangladesh operation of the Bank | 42.5 | 42.5 |
| Commercial Development Company PLC | 28 | 28 |
| ONEzero Company Ltd. | 28 | 28 |
| Indra Finance Ltd. | 28 | N/A |
Notional Tax Credit for Withholding Tax on Government Securities on Secondary Market Transactions
As per Section 137 of the Inland Revenue Act No. 10 of 2006 and amendments thereto, a Company engaged in secondary market transactions involving Government Securities, Treasury Bills or Treasury Bonds on which Income tax had been deducted at 10% per annum at the time of issue of such securities, is entitled to a notional tax credit of one-ninth of Net Interest Income earned from such secondary market transactions.
Accordingly, the net interest income earned by the Group and the Bank from the secondary market transactions in Government Securities, has been grossed up in these Financial Statements and such notional tax credit amounted to Rs. 1,080.686 Mn. and Rs. 1,079.038 Mn. respectively (Rs. 905.407 Mn. and Rs. 903.649 Mn. respectively in 2013).
21.2 Reconciliation of the Accounting Profit to Income Tax Expense
A reconciliation between taxable income and the accounting profit multiplied by the statutory tax rate is given below:
| Tax Rate | GROUP | BANK | ||||
| For the year ended December 31, | 2014 | 2013 | 2014 | 2013 | 2014 | 2013 |
| % | % | Rs. ’000 | Rs. ’000 | Rs. ’000 | Rs. ’000 | |
| Accounting profit before tax from operations | 15,859,917 | 14,690,918 | 15,736,216 | 14,510,519 | ||
| Tax effect at the statutory income tax rate | 4,932,962 | 4,430,380 | 4,874,034 | 4,389,700 | ||
| Domestic operations of the Bank | 28 | 28 | 3,440,752 | 3,256,166 | 3,440,752 | 3,256,166 |
| Off-shore banking operation of the Bank | 28 | 28 | 268,589 | 167,244 | 268,589 | 167,244 |
| Bangladesh operation | 42.5 | 42.5 | 1,164,693 | 966,290 | 1,164,693 | 966,290 |
| Subsidiaries | 28 | 28 | 58,928 | 40,680 | – | – |
| Tax effect of exempt income | (865,453) | (887,400) | (865,453) | (887,400) | ||
| Tax effect of non-deductible expenses | 5,834,186 | 4,359,378 | 5,807,179 | 4,344,749 | ||
| Tax effect of deductible expenses | (5,169,064) | (3,832,519) | (5,142,943) | (3,824,600) | ||
| Qualifying payments | (256,493) | – | (256,493) | – | ||
| Under/(over) provision of taxes in respect of prior years [Refer Note 44] | 10,920 | (167,169) | 11,041 | (169,789) | ||
| Withholding tax on dividends paid | 7,879 | 8,285 | 7,789 | 8,285 | ||
| Deferred tax expense [Refer Notes 45.2 & 45.3] | 122,187 | 206,506 | 120,881 | 204,063 | ||
| Income tax expense reported in the Income Statement at the effective income tax rate |
4,617,124 | 4,117,461 | 4,556,035 | 4,065,008 | ||
22. Earnings Per Share (EPS)
The earnings per share has been calculated by dividing the profit for the year attributable to equity holders of the Parent by the weighted average number of ordinary shares in issue during the year, as per the Sri Lanka Accounting Standard - LKAS 33 on Earnings per Share.
22.1 Basic Earnings per Ordinary Share
| GROUP | BANK | |||
| 2014 | 2013 | 2014 | 2013 | |
| Amounts used as the numerator: | ||||
| Profit for the year attributable to equity holders of the Bank for basic earnings per ordinary share (Rs. ’000) | 11,238,892 | 10,563,378 | 11,180,181 | 10,445,511 |
| Number of ordinary shares used as the denominator: | ||||
| Weighted average number of ordinary shares for basic earnings per share calculation [Refer Note 22.3] | 864,152,525 | 862,938,805 | 864,152,525 | 862,938,805 |
| Basic earnings per ordinary share (Rs.) | 13.01 | 12.24 | 12.94 | 12.10 |
22.2 Diluted Earnings per Ordinary Share
| GROUP | BANK | |||
| 2014 | 2013 | 2014 | 2013 | |
| Amounts used as the numerator: | ||||
| Profit for the year attributable to equity holders of the parent for diluted earnings per ordinary share (Rs. ’000) | 11,238,892 | 10,563,378 | 11,180,181 | 10,445,511 |
| Number of ordinary shares used as the denominator: | ||||
| Weighted average number of ordinary shares for diluted earnings per ordinary share calculation [Refer Note 22.3] | 867,855,677 | 864,273,527 | 867,855,677 | 864,273,527 |
| Diluted earnings per ordinary share (Rs.) | 12.95 | 12.22 | 12.88 | 12.09 |
22.3 Weighted Average Number of Ordinary Shares for Basic and Diluted Earnings per Share
| Outstanding No. of Shares | Weighted average No. of Shares | |||
| 2014 | 2013 | 2014 | 2013 | |
| Number of shares in issue as at January 01, | 849,079,041 | 833,487,980 | 849,079,041 | 833,487,980 |
| Add: Number of shares satisfied in the form of issue and allotment of new shares from final dividend for 2012 | – | 14,145,663 | – | 14,145,663 |
| Add: Number of shares satisfied in the form of issue and allotment of new shares from final dividend for 2013 | 13,541,068 | – | 13,541,068 | 13,541,068 |
| 862,620,109 | 847,633,643 | 862,620,109 | 861,174,711 | |
| Add: Number of shares issued under Employee Share Option Plan (ESOP) 2008 | 3,237,566 | 1,445,398 | 1,532,416 | 1,764,094 |
| Weighted average number of ordinary shares for basic earnings per ordinary share calculation | 865,857,675 | 849,079,041 | 864,152,525 | 862,938,805 |
| Add: Bonus element on number of outstanding options under ESOP 2008 as at the year-end | – | – | 3,703,152 | 1,334,722 |
| Weighted average number of ordinary shares for diluted earnings per ordinary share calculation(*) | 865,857,675 | 849,079,041 | 867,855,677 | 864,273,527 |
(*) The market value of the Bank’s shares for the purpose of calculating the dilutive effect of share options has been based on the excess of quoted market price as of December 31, 2014 over the offer price.
23. Dividends
| GROUP | BANK | |||
| 2014 Second Interim Rs. 1.00 Per share for 2013 (Paid on January 27, 2014) |
2013 Second Interim Rs. 1.00 Per share for 2012 (Paid on February 18, 2013) |
2014 Second Interim Rs. 1.00 Per share for 2013 (Paid on January 27, 2014) |
2013 Second Interim Rs. 1.00 Per share for 2012 (Paid on February 18, 2013) |
|
| Rs. ’000 | Rs. ’000 | Rs. ’000 | Rs. ’000 | |
| On Ordinary Shares | ||||
| Net dividend paid to the Ordinary shareholders out of normal profits | 768,553 | 755,339 | 768,553 | 755,339 |
| Withholding tax deducted at source | 80,595 | 78,270 | 80,595 | 78,270 |
| Gross ordinary dividend paid | 849,148 | 833,609 | 849,148 | 833,609 |
| First Interim Rs. 1.50 Per share for 2014 (Paid on November 21, 2014) |
First Interim Rs. 1.50 Per share for 2013 (Paid on November 19, 2013) |
First Interim Rs. 1.50 Per share for 2014 (Paid on November 21, 2014) |
First Interim Rs. 1.50 Per share for 2013 (Paid on November 19, 2013) |
|
| Rs. ’000 | Rs. ’000 | Rs. ’000 | Rs. ’000 | |
| On Ordinary Shares | ||||
| Net dividend paid to the ordinary shareholders out of normal profits | 1,174,561 | 1,152,615 | 1,174,561 | 1,152,615 |
| Withholding tax deducted at source | 123,593 | 120,876 | 123,593 | 120,876 |
| Gross ordinary dividend paid | 1,298,154 | 1,273,491 | 1,298,154 | 1,273,491 |
| Total gross ordinary dividend paid | 2,147,302 | 2,107,100 | 2,147,302 | 2,107,100 |
The Bank declared and paid a second interim dividend of Rs. 1.00 per share on February 5, 2015 to both voting and non-voting ordinary shareholders of the Bank. (The second interim dividend for the year 2013 of Rs. 1.00 per share was paid on January 27, 2014 ).
The Board of Directors of the Bank has recommended the payment of a final dividend of Rs. 4.00 per share which consist of a cash dividend of Rs. 2.00 per share and the balance entitlement of Rs. 2.00 per share will be satisfied in the form of issue and allotment of new shares for both the voting and non-voting ordinary shareholders of the Bank for the year ended December 31, 2014 (Bank declared a final dividend of Rs. 4.00 per share in 2013 and this was satisfied by way of Rs. 2.00 per share in the form of cash and Rs. 2.00 per share in the form of shares). The total dividend recommended by the Board is to be approved at the forthcoming Annual General Meeting to be held on March 31, 2015. In accordance with provisions of the Sri Lanka Accounting Standard No. 10 on ‘Events after the Reporting Period’, the second interim dividend declared and paid on February 5, 2015 and the proposed final dividend has not been recognised as a liability as at the year-end. Final dividend payable for the year 2014 has been estimated at Rs. 3,463.772 Mn. (Actual final dividend for 2013 amounted to Rs. 3,399.834 Mn. due to exercise of options under ESOPs).
Accordingly, the dividend per ordinary share (for both voting and non-voting) for the year 2014 would be Rs. 6.50 (2013 - Rs. 6.50).
24. Classification of Financial Assets and Financial Liabilities
The tables below provide a reconciliation between the line items in the Statement of Financial Position and categories of financial assets and financial liabilities of the Group and the Bank.
24.1 Classification of Financial Assets and Financial Liabilities - Group
24.1 (a) Group
| As at December 31, 2014 | Held-for-Trading (HFT) |
Held-to-Maturity (HTM) |
Loans and Receivables |
Available- for-Sale (AFS) |
Other Amortised Cost |
Total | |
| Note | Rs. ’000 | Rs. ’000 | Rs. ’000 | Rs. ’000 | Rs. ’000 | Rs. ’000 | |
| Financial Assets | |||||||
| Cash and cash equivalents | 26 | – | – | 20,621,778 | – | – | 20,621,778 |
| Balances with Central Banks | 27 | – | – | 19,633,746 | – | – | 19,633,746 |
| Placements with banks | 28 | – | – | 14,507,861 | – | – | 14,507,861 |
| Derivative financial assets | 29 | 459,510 | – | – | – | – | 459,510 |
| Other financial instruments – Held-for-trading | 30 | 6,326,636 | – | – | – | – | 6,326,636 |
| Loans and receivables to banks | 31 | – | – | 551,066 | – | – | 551,066 |
| Loans and receivables to other customers | 32 | – | – | 498,165,419 | – | – | 498,165,419 |
| Financial investments – Available-for-sale | 33 | – | – | – | 214,225,017 | – | 214,225,017 |
| Total financial assets | 6,786,146 | – | 553,479,870 | 214,225,017 | – | 774,491,033 | |
| Financial Liabilities | |||||||
| Due to banks | 40 | – | – | – | – | 25,669,025 | 25,669,025 |
| Derivative financial liabilities | 41 | 1,193,139 | – | – | – | – | 1,193,139 |
| Due to other customers/Deposits from customers | 42 | – | – | – | – | 529,266,588 | 529,266,588 |
| Other borrowings | 43 | – | – | – | – | 136,027,625 | 136,027,625 |
| Subordinated liabilities | 49 | – | – | – | – | 11,262,573 | 11,262,573 |
| Total financial liabilities | 1,193,139 | – | – | – | 702,225,811 | 703,418,950 |
24.1 (b) Group
| As at December 31, 2013 | Held-for-Trading (HFT) |
Held-to-Maturity (HTM) |
Loans and Receivables |
Available- for-Sale (AFS) |
Other Amortised Cost |
Total | |
| Note | Rs. ’000 | Rs. ’000 | Rs. ’000 | Rs. ’000 | Rs. ’000 | Rs. ’000 | |
| Financial Assets | |||||||
| Cash and cash equivalents | 26 | – | – | 14,263,533 | – | – | 14,263,533 |
| Balances with Central Banks | 27 | – | – | 18,431,936 | – | – | 18,431,936 |
| Placements with banks | 28 | – | – | 4,131,814 | – | – | 4,131,814 |
| Derivative financial assets | 29 | 837,694 | – | – | – | – | 837,694 |
| Other financial instruments – Held-for-trading | 30 | 6,379,058 | – | – | – | – | 6,379,058 |
| Loans and receivables to banks | 31 | – | – | 546,270 | – | – | 546,270 |
| Loans and receivables to other customers | 32 | – | – | 410,935,979 | – | – | 410,935,979 |
| Financial investments – Available-for-sale | 33 | – | – | – | 131,756,525 | – | 131,756,525 |
| Total financial assets | 7,216,752 | – | 448,309,532 | 131,756,525 | – | 587,282,809 | |
| Financial Liabilities | |||||||
| Due to banks | 40 | – | – | – | – | 14,194,219 | 14,194,219 |
| Derivative financial liabilities | 41 | 1,411,916 | – | – | – | – | 1,411,916 |
| Due to other customers/Deposits from customers |
42 | – | – | – | – | 451,098,946 | 451,098,946 |
| Other borrowings | 43 | – | – | – | – | 53,997,503 | 53,997,503 |
| Subordinated liabilities | 49 | – | – | – | – | 10,944,412 | 10,944,412 |
| Total financial liabilities | 1,411,916 | – | – | – | 530,235,080 | 531,646,996 |
24.2 Classification of Financial Assets and Financial Liabilities - Bank
24.2 (a) Bank
| As at December 31, 2014 | Held-for-Trading (HFT) |
Held-to-Maturity (HTM) |
Loans and Receivables |
Available- for-Sale (AFS) |
Other Amortised Cost |
Total | ||
| Note | Rs. ’000 | Rs. ’000 | Rs. ’000 | Rs. ’000 | Rs. ’000 | Rs. ’000 | ||
| Financial Assets | ||||||||
| Cash and cash equivalents | 26 | – | – | 20,591,867 | – | – | 20,591,867 | |
| Balances with Central Banks | 27 | – | – | 19,633,746 | – | – | 19,633,746 | |
| Placements with banks | 28 | – | – | 14,507,861 | – | – | 14,507,861 | |
| Derivative financial assets | 29 | 459,510 | – | – | – | – | 459,510 | |
| Other financial instruments – Held-for-trading | 30 | 6,326,636 | – | – | – | – | 6,326,636 | |
| Loans and receivables to banks | 31 | – | – | 551,066 | – | – | 551,066 | |
| Loans and receivables to other customers | 32 | – | – | 497,065,787 | – | – | 497,065,787 | |
| Financial investments – Available-for-sale | 33 | – | – | – | 214,208,370 | – | 214,208,370 | |
| Total financial assets | 6,786,146 | – | 552,350,327 | 214,208,370 | – | 773,344,843 | ||
| Financial Liabilities | ||||||||
| Due to banks | 40 | – | – | – | – | 25,260,976 | 25,260,976 | |
| Derivative financial liabilities | 41 | 1,193,139 | – | – | – | – | 1,193,139 | |
| Due to other customers/Deposits from customers | 42 | – | – | – | – | 529,361,484 | 529,361,484 | |
| Other borrowings | 43 | – | – | – | – | 136,201,082 | 136,201,082 | |
| Subordinated liabilities | 49 | – | – | – | – | 11,044,775 | 11,044,775 | |
| Total financial liabilities | 1,193,139 | – | – | – | 701,868,317 | 703,061,456 |
24.2 (b) Bank
| As at December 31, 2013 | Held-for-Trading (HFT) |
Held-to-Maturity (HTM) |
Loans and Receivables |
Available- for-Sale (AFS) |
Other Amortised Cost |
Total | |
| Note | Rs. ’000 | Rs. ’000 | Rs. ’000 | Rs. ’000 | Rs. ’000 | Rs. ’000 | |
| Financial Assets | |||||||
| Cash and cash equivalents | 26 | – | – | 14,261,549 | – | – | 14,261,549 |
| Balances with Central Banks | 27 | – | – | 18,431,936 | – | – | 18,431,936 |
| Placements with banks | 28 | – | – | 4,131,814 | – | – | 4,131,814 |
| Derivative financial assets | 29 | 837,694 | – | – | – | – | 837,694 |
| Other financial instruments – Held-for-trading | 30 | 6,379,058 | – | – | – | – | 6,379,058 |
| Loans and receivables to banks | 31 | – | – | 546,270 | – | – | 546,270 |
| Loans and receivables to other customers | 32 | – | – | 410,951,440 | – | – | 410,951,440 |
| Financial investments – Available-for-sale | 33 | – | – | – | 131,756,525 | – | 131,756,525 |
| Total financial assets | 7,216,752 | – | 448,323,009 | 131,756,525 | – | 587,296,286 | |
| Financial Liabilities | |||||||
| Due to banks | 40 | – | – | – | – | 14,194,219 | 14,194,219 |
| Derivative financial liabilities | 41 | 1,411,916 | – | – | – | – | 1,411,916 |
| Due to other customers/Deposits from customers | 42 | – | – | – | – | 451,152,923 | 451,152,923 |
| Other borrowings | 43 | – | – | – | – | 54,173,175 | 54,173,175 |
| Subordinated liabilities | 49 | – | – | – | – | 10,944,412 | 10,944,412 |
| Total financial liabilities | 1,411,916 | – | – | – | 530,464,729 | 531,876,645 |
25. Assets and Liabilities Measured at Fair Value and Fair Value Hierarchy
25.1 Fair Value Hierarchy
The following table provides the analyses of assets and liabilities measured at fair value as at the Reporting date, by the level in the fair value hierarchy into which the fair value measurement is categorised. These amounts were based on the values recognised in the Statement of Financial Position.
| GROUP | BANK | ||||||||
| Level 1 | Level 2 | Level 3 | Total | Level 1 | Level 2 | Level 3 | Total | ||
| Note | Rs. ’000 | Rs. ’000 | Rs. ’000 | Rs. ’000 | Rs. ’000 | Rs. ’000 | Rs. ’000 | Rs. ’000 | |
| As at December 31, 2014 | |||||||||
| Non-Financial Assets | |||||||||
| Property, Plant & Equipment | |||||||||
| Land and buildings | 36.5(b) | – | – | 7,432,625 | 7,432,625 | – | – | 7,255,625 | 7,255,625 |
| Total non-financial assets at fair value | – | – | 7,432,625 | 7,432,625 | – | – | 7,255,625 | 7,255,625 | |
| Financial Assets | |||||||||
| Derivative financial assets | 29 | ||||||||
| Currency swaps | – | 222,533 | – | 222,533 | – | 222,533 | – | 222,533 | |
| Forward contracts | – | 233,300 | – | 233,300 | – | 233,300 | – | 233,300 | |
| Spot contracts | – | 3,677 | – | 3,677 | – | 3,677 | – | 3,677 | |
| Other financial instruments – Held-for-trading |
30 | ||||||||
| Government securities | 5,958,904 | – | – | 5,958,904 | 5,958,904 | – | – | 5,958,904 | |
| Equity shares | 367,732 | – | – | 367,732 | 367,732 | – | – | 367,732 | |
| Financial investments – Available-for-sale |
33 | ||||||||
| Government Securities | 213,381,263 | – | – | 213,381,263 | 213,364,740 | – | – | 213,364,740 | |
| Equity securities(*) | 185,132 | 613,441 | – | 798,573 | 185,132 | 613,441 | – | 798,573 | |
| Total financial assets at fair value |
219,893,031 | 1,072,951 | – | 220,965,982 | 219,876,508 | 1,072,951 | – | 220,949,459 | |
| Total assets at fair value | 219,893,031 | 1,072,951 | 7,432,625 | 228,398,607 | 219,876,508 | 1,072,951 | 7,255,625 | 228,205,084 | |
| Financial Liabilities | |||||||||
| Derivative financial liabilities | 41 | ||||||||
| Currency swaps | – | 823,596 | – | 823,596 | – | 823,596 | – | 823,596 | |
| Forward contracts | – | 368,886 | – | 368,886 | – | 368,886 | – | 368,886 | |
| Spot contracts | – | 657 | – | 657 | – | 657 | – | 657 | |
| Total liabilities at fair value | – | 1,193,139 | – | 1,193,139 | – | 1,193,139 | – | 1,193,139 | |
| As at December 31, 2013 | |||||||||
| Non-Financial Assets | |||||||||
| Property, Plant & Equipment | |||||||||
| Land and buildings | 36 | – | – | 5,647,563 | 5,647,563 | – | – | 5,647,563 | 5,647,563 |
| Total non-financial assets at fair value | – | – | 5,647,563 | 5,647,563 | – | – | 5,647,563 | 5,647,563 | |
| Financial Assets | |||||||||
| Derivative financial assets | 29 | ||||||||
| Currency swaps | – | – | – | – | – | – | – | – | |
| Forward contracts | – | 832,346 | – | 832,346 | – | 832,346 | – | 832,346 | |
| Spot contracts | – | 5,348 | – | 5,348 | – | 5,348 | – | 5,348 | |
| Other financial instruments – Held-for-trading | 30 | ||||||||
| Government Securities | 6,044,651 | – | – | 6,044,651 | 6,044,651 | – | – | 6,044,651 | |
| Equity shares | 334,407 | – | – | 334,407 | 334,407 | – | – | 334,407 | |
| Financial investments – Available-for-sale | 33 | ||||||||
| Government Securities | 131,565,941 | – | – | 131,565,941 | 131,565,941 | – | – | 131,565,941 | |
| Equity securities(*) | 145,492 | – | – | 145,492 | 145,492 | – | – | 145,492 | |
| Total financial assets at fair value | 138,090,491 | 837,694 | – | 138,928,185 | 138,090,491 | 837,694 | – | 138,928,185 | |
| Total assets at fair value | 138,090,491 | 837,694 | 5,647,563 | 144,575,748 | 138,090,491 | 837,694 | 5,647,563 | 144,575,748 | |
| Financial Liabilities | |||||||||
| Derivative financial liabilities | 41 | ||||||||
| Currency swaps | – | – | – | – | – | – | – | – | |
| Forward contracts | – | 1,406,553 | – | 1,406,553 | – | 1,406,553 | – | 1,406,553 | |
| Spot contracts | – | 5,363 | – | 5,363 | – | 5,363 | – | 5,363 | |
| Total liabilities at fair value | – | 1,411,916 | – | 1,411,916 | – | 1,411,916 | – | 1,411,916 | |
(*) Value of Unquoted shares of Rs. 45.181 Mn. in Group and Rs. 45.057 Mn. in Bank as at end of the year 2014 (Rs. 45.092 Mn. in Group and Bank as at end 2013) categorised under Financial Investments – Available-for-sale in the Statement of Financial Position has not been considered within the above amount due to non-availability of reliable market values.
25.2 Financial Instruments not Measured at Fair Value - Fair Value Hierarchy
The following table sets out the fair values of financial assets and liabilities not measured at fair value and related fair value hierarchy.
| GROUP | BANK | ||||||||||
| Level 1 | Level 2 | Level 3 | Total Fair Values |
Total Carrying Amount |
Level 1 | Level 2 | Level 3 | Total Fair Values |
Total Carrying Amount |
||
| Note | Rs. ’000 | Rs. ’000 | Rs. ’000 | Rs. '000 | Rs. '000 | Rs. ’000 | Rs. ’000 | Rs. ’000 | Rs. '000 | Rs. '000 | |
As at December 31, 2014 |
|||||||||||
| Financial Assets | |||||||||||
| Cash and cash equivalents | 26 | – | 20,621,778 | – | 20,621,778 | 20,621,778 | – | 20,591,867 | – | 20,591,867 | 20,591,867 |
| Loans and receivables to banks | 31 | – | 551,066 | – | 551,066 | 551,066 | – | 551,066 | – | 551,066 | 551,066 |
| Loans and receivables to other customers | 32 | – | – | 500,659,378 | 500,659,378 | 498,165,419 | – | – | 499,559,746 | 499,559,746 | 497,065,787 |
| Total financial assets not at fair value | – | 21,172,844 | 500,659,378 | 521,832,222 | 519,338,263 | – | 21,142,933 | 499,559,746 | 520,702,679 | 518,208,720 | |
| Financial Liabilities | |||||||||||
| Due to banks | 40 | – | 25,669,025 | – | 25,669,025 | 25,669,025 | – | 25,260,976 | – | 25,260,976 | 25,260,976 |
| Due to other customers/Deposits from customers | 42 | – | – | 531,209,832 | 531,209,832 | 529,266,588 | – | – | 531,304,728 | 531,304,728 | 529,361,484 |
| Subordinated liabilities | 49 | – | – | 11,347,778 | 11,347,778 | 11,262,573 | – | – | 11,129,980 | 11,129,980 | 11,044,775 |
| Total financial liabilities not at fair value | – | 25,669,025 | 542,557,610 | 568,226,635 | 566,198,186 | – | 25,260,976 | 542,434,708 | 567,695,684 | 565,667,235 | |
As at December 31, 2013 |
|||||||||||
| Financial Assets | |||||||||||
| Cash and cash equivalents | 26 | – | 14,263,533 | – | 14,263,533 | 14,263,533 | – | 14,261,549 | – | 14,261,549 | 14,261,549 |
| Loans and receivables to banks | 31 | – | 546,270 | – | 546,270 | 546,270 | – | 546,270 | – | 546,270 | 546,270 |
| Loans and receivables to other customers | 32 | – | – | 411,737,311 | 411,737,311 | 410,935,979 | – | – | 411,752,772 | 411,752,772 | 410,951,440 |
| Total financial assets not at fair value | – | 14,809,803 | 411,737,311 | 426,547,114 | 425,745,782 | – | 14,807,819 | 411,752,772 | 426,560,591 | 425,759,259 | |
| Financial Liabilities | |||||||||||
| Due to banks | 40 | – | 14,194,219 | – | 14,194,219 | 14,194,219 | – | 14,194,219 | – | 14,194,219 | 14,194,219 |
| Due to other customers/Deposits from customers | 42 | – | – | 452,436,796 | 452,436,796 | 451,098,946 | – | – | 452,490,773 | 452,490,773 | 451,152,923 |
| Subordinated liabilities | 49 | – | – | 11,013,207 | 11,013,207 | 10,944,412 | – | – | 11,013,207 | 11,013,207 | 10,944,412 |
| Total financial liabilities not at fair value | – | 14,194,219 | 463,449,603 | 477,643,822 | 476,237,577 | – | 14,194,219 | 463,503,980 | 447,698,199 | 476,291,554 | |
Fair Valuation Methodology and Significant Unobservable Valuation Inputs
The fair value of fixed rate financial assets and liabilities carried at amortised cost (eg. fixed rate loans and receivables due to other customers, subordinated liabilities) are estimated based on the Discounted Cash Flow approach. This approach employs the current market interest rates of similar financial instruments as a significant unobservable input in measuring the fair value and hence it is categorised under Level 3 in the fair value hierarchy.
Sensitivity of Fair Value Measurement to Unobservable Inputs
A significant increase/(decrease) in the market interest rate would result in lower/(higher) fair value being disclosed.
Assets for which Fair Value Approximates Carrying Value
For financial assets and liabilities with short term maturities or with short term re-pricing intervals, it is assumed that the carrying amounts approximate to their fair value. This assumption is also applied to demand deposits and savings deposits which do not have a specific maturity.
25.3
Note 36.5 (b) provides information on significant unobservable inputs used as at December 31, 2014 used in measuring fair value of Land and buildings categorised as Level 3 in the fair value hierarchy.
25.4
Reconciliation of Revaluation Reserve pertaining to Land and Buildings categorised as Level 3 in fair value hierarchy is found in the Statement of Changes in Equity.
25.5
Table below provides information about the valuation techniques and inputs used in measuring the fair values of assets and liabilities in the Level 2 of the fair value hierarchy as given in Note 25.1 above.
| Type of Financial Instruments | Fair Value as at December 31, 2014 (Rs. ’000) |
Valuation Technique | Significant Valuation inputs | |
| Derivative Financial Assets | 459,510 | Adjusted forward rate approach
This approach considers the present value of calculated forward exchange rate as of the reporting date using the spot exchange rate that prevailed and the forward premium/discount calculated using extrapolated interest rates of the currency pairs of the derivatives. In computing the present value, interest rate differentials between two currencies under consideration is used as the discount rate. |
|
|
| Derivative Financial Liabilities | 1,193,139 |
26. Cash and Cash Equivalents
| GROUP | BANK | |||
| As at December 31, | 2014 | 2013 | 2014 | 2013 |
| Rs. ’000 | Rs. ’000 | Rs. ’000 | Rs. ’000 | |
| Cash in hand | ||||
| Coins and notes held in local currency | 12,232,921 | 9,643,069 | 12,222,065 | 9,641,519 |
| Coins and notes held in foreign currency | 1,440,699 | 1,866,981 | 1,426,445 | 1,866,547 |
| Balances with banks | 5,948,158 | 2,635,082 | 5,943,357 | 2,635,082 |
| Local banks | 4.801 | – | – | – |
| Foreign banks | 5,943,357 | 2,635,082 | 5,943,357 | 2,635,082 |
| Money at call and at short notice | 1,000,000 | 118,401 | 1,000,000 | 118,401 |
| Total | 20,621,778 | 14,263,533 | 20,591,867 | 14,261,549 |
The maturity analysis of Cash and Cash Equivalents is given in Note 58.
27. Balances with Central Banks
| GROUP | BANK | |||
| As at December 31, | 2014 | 2013 | 2014 | 2013 |
| Rs. ’000 | Rs. ’000 | Rs. ’000 | Rs. ’000 | |
| Statutory balances with Central Banks | ||||
| Central Bank of Sri Lanka | 17,433,858 | 15,449,704 | 17,433,858 | 15,449,704 |
| Bangladesh Bank | 2,199,888 | 2,982,232 | 2,199,888 | 2,982,232 |
| Non-statutory balances with Central Banks | ||||
| Central Bank of Sri Lanka | – | – | – | – |
| Bangladesh Bank | – | – | – | – |
| Total | 19,633,746 | 18,431,936 | 19,633,746 | 18,431,936 |
As required by the provisions of Section 93 of the Monetary Law Act, a cash balance is maintained with the Central Bank of Sri Lanka. As at December 31, 2014, the minimum cash reserve requirement was 6.00% of the rupee deposit liabilities (6.00% in 2013). There is no reserve requirement for foreign currency deposit liabilities of the Domestic Banking Unit and the deposit liabilities of the Off-shore Banking Centre (OBC) in Sri Lanka.
As per the Bangladesh Bank regulations, the Statutory Liquidity Requirement as at December 31, 2014 was 19.50% (19.00% in 2013) on time and demand liabilities (both local and foreign currencies), which includes a 6.50% (6.00% in 2013) cash reserve requirement and the balance 13.00% (13.00% in 2013) is permitted to be maintained in foreign currency and/or also in unencumbered securities held with the Bangladesh Bank.
The maturity analysis of Balances with Central Banks is given in Note 58.
28. Placements with Banks
| GROUP | BANK | |||
| As at December 31, | 2014 | 2013 | 2014 | 2013 |
| Rs. ’000 | Rs. ’000 | Rs. ’000 | Rs. ’000 | |
| Placements - within Sri Lanka | 6,783,931 | – | 6,783,931 | – |
| Placements - outside Sri Lanka | 7,723,930 | 4,131,814 | 7,723,930 | 4,131,814 |
| Total | 14,507,861 | 4,131,814 | 14,507,861 | 4,131,814 |
The maturity analysis of Placements with Banks is given in Note 58.
29. Derivative Financial Assets
| GROUP | BANK | |||
| As at December 31, | 2014 | 2013 | 2014 | 2013 |
| Rs. ’000 | Rs. ’000 | Rs. ’000 | Rs. ’000 | |
| Foreign currency derivatives | ||||
| Currency swaps | 222,533 | – | 222,533 | – |
| Forward contracts | 233,300 | 832,346 | 233,300 | 832,346 |
| Spot contracts | 3,677 | 5,348 | 3,677 | 5,348 |
| Total | 459,510 | 837,694 | 459,510 | 837,694 |
The maturity analysis of Derivative Financial Assets is given in Note 58.
30. Other Financial Instruments Held-for-Trading
| GROUP | BANK | |||
| As at December 31, | 2014 | 2013 | 2014 | 2013 |
| Rs. ’000 | Rs. ’000 | Rs. ’000 | Rs. ’000 | |
| Government securities [Refer Note 30.1] | 5,958,904 | 6,044,651 | 5,958,904 | 6,044,651 |
| Equity securities [Refer Note 30.2] | 367,732 | 334,407 | 367,732 | 334,407 |
| Total | 6,326,636 | 6,379,058 | 6,326,636 | 6,379,058 |
30.1 Government Securities
| GROUP | BANK | |||
| As at December 31, | 2014 | 2013 | 2014 | 2013 |
| Rs. ’000 | Rs. ’000 | Rs. ’000 | Rs. ’000 | |
| Treasury bills | 4,224,163 | 4,788,578 | 4,224,163 | 4,788,578 |
| Treasury bonds | 1,734,741 | 1,256,073 | 1,734,741 | 1,256,073 |
| Total Government Securities | 5,958,904 | 6,044,651 | 5,958,904 | 6,044,651 |
The maturity analysis of Other Financial Instruments Held-for-trading is given in Note 58.
30.2 Equity Securities - Group and Bank
| As at December 31, 2014 | As at December 31, 2013 | |||||||
| Sector/Name of the Company | No. of Shares |
Market Price |
Market Value |
Cost of the Investment |
No. of Shares |
Market Price |
Market Value |
Cost of the Investment |
| Rs. | Rs. ’000 | Rs. ’000 | Rs. | Rs. ’000 | Rs. ’000 | |||
| Bank, Finance and Insurance | ||||||||
| Central Finance Company PLC | 94,930 | 250.00 | 23,733 | 18,937 | – | – | – | – |
| Citizen Development Bank PLC | 101,965 | 74.00 | 7,545 | 3,398 | 123,950 | 35.60 | 4,413 | 4,130 |
| Hatton National Bank PLC | 82 | 194.90 | 16 | 12 | 82 | 147.00 | 12 | 12 |
| Lanka Venture PLC | 100,000 | 46.90 | 4,690 | 3,033 | 100,000 | 41.00 | 4,100 | 3,033 |
| Nations Trust Bank PLC | – | – | – | – | 262,314 | 62.20 | 16,316 | 16,238 |
| Sampath Bank PLC | 25,000 | 236.30 | 5,908 | 4,298 | 25,000 | 171.90 | 4,298 | 4,298 |
| Sub total | 41,892 | 29,678 | 29,139 | 27,711 | ||||
| Beverage, Foods and Tobacco | ||||||||
| COCO Lanka PLC | 402,000 | 26.70 | 10,733 | 7,062 | 402,000 | 16.50 | 6,633 | 7,062 |
| COCO Lanka PLC (Non-voting) | 1,000 | 23.90 | 24 | 15 | 1,000 | 13.10 | 13 | 15 |
| Distilleries Company of Sri Lanka PLC | 181,490 | 210.00 | 38,113 | 28,968 | 281,490 | 193.00 | 54,328 | 44,929 |
| Lanka Milk Foods (CWE) PLC | 250,000 | 120.40 | 30,100 | 27,866 | 250,000 | 105.30 | 26,325 | 27,866 |
| Sub total | 78,970 | 63,911 | 87,299 | 79,872 | ||||
| Chemical and Pharmaceutical | ||||||||
| Chemical Industries Colombo PLC | 161,400 | 66.40 | 10,717 | 11,692 | 161,400 | 34.50 | 5,568 | 11,692 |
| Haycarb PLC | 107,100 | 173.00 | 18,528 | 15,914 | 107,100 | 189.80 | 20,328 | 15,914 |
| Sub total | 29,245 | 27,606 | 25,896 | 27,606 | ||||
| Construction and Engineering | ||||||||
| Colombo Dockyard PLC | 75,000 | 193.00 | 14,475 | 16,685 | 75,000 | 189.60 | 14,220 | 16,685 |
| Sub total | 14,475 | 16,685 | 14,220 | 16,685 | ||||
| Diversified Holdings | ||||||||
| Hemas Holdings PLC | 60 | 74.30 | 4 | 2 | 635,750 | 34.00 | 21,616 | 23,242 |
| Sub total | 4 | 2 | 21,616 | 23,242 | ||||
| Health Care | ||||||||
| Ceylon Hospitals PLC | 121,900 | 117.40 | 14,311 | 12,868 | 156,900 | 110.00 | 17,259 | 16,665 |
| Ceylon Hospitals PLC (Non-voting) | 61,100 | 80.00 | 4,888 | 4,423 | 61,100 | 75.00 | 4,583 | 4,423 |
| Sub total | 19,199 | 17,291 | 21,842 | 21,088 | ||||
| Hotels and Travels | ||||||||
| John Keells Hotels PLC | 267,608 | 17.00 | 4,549 | 3,473 | 137,608 | 12.50 | 1,720 | 1,638 |
| Taj Lanka Hotels PLC | 212,390 | 34.40 | 7,306 | 6,625 | – | – | – | – |
| Sub total | 11,855 | 10,098 | 1,720 | 1,638 | ||||
| Investment Trust | ||||||||
| Renuka Holdings PLC | 117,158 | 31.50 | 3,690 | 3,180 | 50,000 | 30.60 | 1,530 | 1,770 |
| Renuka Holdings PLC (Non-voting) | 265,368 | 23.50 | 6,236 | 4,958 | 100,000 | 20.70 | 2,070 | 2,477 |
| Sub total | 9,926 | 8,138 | 3,600 | 4,247 | ||||
| Land and Property | ||||||||
| Overseas Reality Ceylon PLC | 174,000 | 26.30 | 4,576 | 2,512 | 174,000 | 18.30 | 3,184 | 2,512 |
| Property Developments Ltd. | – | – | – | – | 83,235 | 66.00 | 5,494 | 4,693 |
| Sub total | 4,576 | 2,512 | 8,678 | 7,205 | ||||
| Manufacturing | ||||||||
| ACL Cables PLC | 171,516 | 76.40 | 13,104 | 14,096 | 171,516 | 64.90 | 11,131 | 14,096 |
| Dipped Products PLC | 200,000 | 143.00 | 28,600 | 24,239 | 200,000 | 90.00 | 18,000 | 24,239 |
| Lanka Walltile PLC | 60 | 97.30 | 6 | 5 | 60 | 53.90 | 3 | 5 |
| Pelwatte Sugar Industries PLC | 12,300 | 0.10 | 1 | 351 | 12,300 | 0.10 | 1 | 351 |
| Royal Ceramics Lanka PLC | 264,896 | 116.90 | 30,966 | 30,676 | 264,896 | 84.60 | 22,410 | 30,676 |
| Tokyo Cement Company (Lanka) PLC (Non-voting) |
140,055 | 46.90 | 6,569 | 3,407 | 588,555 | 23.40 | 13,772 | 15,502 |
| Sub total | 79,246 | 72,774 | 65,317 | 84,869 | ||||
| Plantations | ||||||||
| Kotagala Plantations PLC | 201,750 | 31.60 | 6,375 | 9,172 | 201,750 | 37.00 | 7,465 | 9,172 |
| Sub total | 6,375 | 9,172 | 7,465 | 9,172 | ||||
| Power and Energy | ||||||||
| Hemas Power PLC | 600,000 | 18.10 | 10,860 | 11,591 | 336,657 | 17.60 | 5,925 | 6,748 |
| Lanka IOC PLC | 685,984 | 60.00 | 41,159 | 15,013 | 685,984 | 33.10 | 22,706 | 15,013 |
| Sub total | 52,019 | 26,604 | 28,631 | 21,761 | ||||
| Telecommunication | ||||||||
| Dialog Axiata PLC | 1,500,000 | 13.30 | 19,950 | 9,956 | 2,109,322 | 9.00 | 18,984 | 15,193 |
| Sub total | 19,950 | 9,956 | 18,984 | 15,193 | ||||
| Total | 367,732 | 294,427 | 334,407 | 340,289 | ||||
| Mark to market gains/(losses) | 73,305 | (5,882) | ||||||
| Market value of equity securities | 367,732 | 334,407 | ||||||
30.3 Industry/Sector Composition of the Equity Securities - Group and Bank
| As at December 31, 2014 | As at December 31, 2013 | |||||
| Sector/Industry | Market Value |
Cost of Investment |
Market Value |
Cost of Investment |
||
| Rs. ’000 | Rs. ’000 | % | Rs. ’000 | Rs. ’000 | % | |
| Bank, Finance and Insurance | 41,892 | 29,678 | 11.39 | 29,139 | 27,711 | 8.71 |
| Beverage, Foods and Tobacco | 78,970 | 63,911 | 21.47 | 87,299 | 79,872 | 26.11 |
| Chemical and Pharmaceutical | 29,245 | 27,606 | 7.95 | 25,896 | 27,606 | 7.74 |
| Construction and Engineering | 14,475 | 16,685 | 3.94 | 14,220 | 16,685 | 4.25 |
| Diversified Holdings | 4 | 2 | 0.0 | 21,616 | 23,242 | 6.46 |
| Health Care | 19,199 | 17,291 | 5.22 | 21,842 | 21,088 | 6.53 |
| Hotels and Travels | 11,855 | 10,098 | 3.22 | 1,720 | 1,638 | 0.51 |
| Investment Trust | 9,926 | 8,138 | 2.71 | 3,600 | 4,247 | 1.08 |
| Land and Property | 4,576 | 2,512 | 1.24 | 8,678 | 7,205 | 2.61 |
| Manufacturing | 79,246 | 72,774 | 21.55 | 65,317 | 84,869 | 19.53 |
| Plantations | 6,375 | 9,172 | 1.73 | 7,465 | 9,172 | 2.23 |
| Power and Energy | 52,019 | 26,604 | 14.15 | 28,631 | 21,761 | 8.56 |
| Telecommunication | 19,950 | 9,956 | 5.43 | 18,984 | 15,193 | 5.68 |
| Sub total | 367,732 | 294,427 | 100 .00 | 334,407 | 340,289 | 100.00 |
| Mark to market gains/(losses) | 73,305 | (5,882) | ||||
| Market value of equity securities | 367,732 | 367,732 | 100 .00 | 334,407 | 334,407 | 100.00 |
31. Loans and Receivables to Banks
| GROUP | BANK | |||
| As at December 31, | 2014 | 2013 | 2014 | 2013 |
| Rs. ’000 | Rs. ’000 | Rs. ’000 | Rs. ’000 | |
| Gross loans and receivables | 551,066 | 546,270 | 551,066 | 546,270 |
| Less: Provision for impairment | – | – | – | – |
| Net loans and receivables | 551,066 | 546,270 | 551,066 | 546,270 |
The maturity analysis of Loans and Receivables to Banks is given in Note 58.
The Bank did not make any payments to counter party banks for the oil hedging transactions with effect from June 02, 2009 in response to a Directive received from the Exchange Controller of the Central Bank of Sri Lanka. Consequently, one of the counter party banks appropriated USD 4.170 Mn. (Rs. 551.066 Mn.) which has been kept as a deposit with them. This action has been contested by the Bank. In view of the stance taken by the Bank in this regard, both the deposit (made by the Bank) and the amount due to the said counter party bank, have been recorded in the Statement of Financial Position.
31.1(a) By Currency
| GROUP | BANK | |||
| As at December 31, | 2014 | 2013 | 2014 | 2013 |
| Rs. ’000 | Rs. ’000 | Rs. ’000 | Rs. ’000 | |
| United States Dollar | 551,066 | 546,270 | 551,066 | 546,270 |
| Sub total | 551,066 | 546,270 | 551,066 | 546,270 |
32. Loans and Receivables to Other Customers
| GROUP | BANK | |||
| As at December 31, | 2014 | 2013 | 2014 | 2013 |
| Rs. ’000 | Rs. ’000 | Rs. ’000 | Rs. ’000 | |
| Gross loans and receivables | 515,335,442 | 426,723,148 | 514,022,361 | 426,738,608 |
| Loans and advances [Refer Note 32.1(a)] | 464,899,378 | 379,237,437 | 463,586,297 | 379,252,897 |
| Investments in Government Securities [Refer Note 32.1(a)] | 40,850,011 | 43,108,697 | 40,850,011 | 43,108,697 |
| Other investments [Refer Note 32.1(a)] | 9,586,053 | 4,377,014 | 9,586,053 | 4,377,014 |
| Less: Provision for individual impairment [Refer Note 32.2] | 4,334,587 | 4,204,654 | 4,334,587 | 4,204,654 |
| Provision for collective impairment [Refer Note 32.2] | 12,835,436 | 11,582,515 | 12,621,987 | 11,582,514 |
| Net loans and receivables | 498,165,419 | 410,935,979 | 497,065,787 | 410,951,440 |
The maturity analysis of Loans and Receivables to Other Customers is given in Note 58.
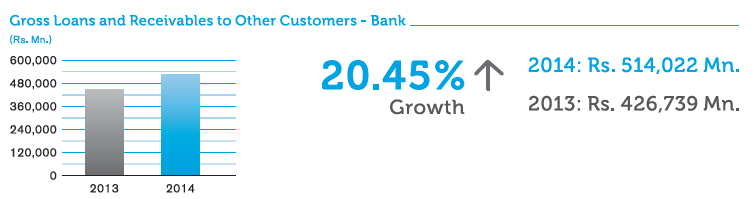
| GROUP | BANK | |||
| As at December 31, | 2014 | 2013 | 2014 | 2013 |
| Rs. ’000 | Rs. ’000 | Rs. ’000 | Rs. ’000 | |
32.1 Analysis |
||||
32.1 (a) By product |
||||
| Loans and receivables | ||||
| Overdrafts | 70,149,877 | 72,420,675 | 70,149,877 | 72,420,675 |
| Trade finance | 41,964,999 | 47,957,137 | 41,964,999 | 47,957,137 |
| Lease/hire purchase receivable [Refer Note 32.3] | 24,814,178 | 21,778,745 | 23,068,581 | 21,795,710 |
| Credit cards | 4,221,367 | 3,999,619 | 4,221,367 | 3,999,619 |
| Pawning | 2,315,884 | 6,995,603 | 2,315,884 | 6,995,603 |
| Staff loans | 5,023,379 | 3,885,911 | 5,022,923 | 3,885,911 |
| Housing loans | 31,402,858 | 27,729,953 | 31,402,858 | 27,729,953 |
| Personal loans | 21,943,589 | 16,517,343 | 21,943,016 | 16,517,343 |
| Term loans | ||||
| Short-term | 31,387,867 | 30,636,267 | 31,974,667 | 30,636,267 |
| Long-term | 178,538,532 | 129,805,616 | 178,385,277 | 129,804,111 |
| Loans granted from Investment Fund Account (IFA) [Refer Note 32.4 (a)] | 4,554,420 | 3,520,411 | 4,554,420 | 3,520,411 |
| Bills of exchange | 7,384,162 | 5,043,658 | 7,384,162 | 5,043,658 |
| Securities purchased under resale agreements | 41,198,266 | 8,946,499 | 41,198,266 | 8,946,499 |
| Sub total [Refer Note 32.1 (c)] | 464,899,378 | 379,237,437 | 463,586,297 | 379,252,897 |
| Investments in Government Securities | ||||
| Treasury bonds | 605,859 | 605,859 | 605,859 | 605,859 |
| Sri Lanka Development bonds | 40,244,152 | 42,502,838 | 40,244,152 | 42,502,838 |
| Sub total | 40,850,011 | 43,108,697 | 40,850,011 | 43,108,697 |
| Other investments | ||||
| Debentures [Refer Note 32.5 (a)] | 8,458,544 | 3,273,401 | 8,458,544 | 3,273,401 |
| Trust certificates [Refer Note 32.5 (b)] | 1,126,469 | 1,029,072 | 1,126,469 | 1,029,072 |
| Corporate bonds in Bangladesh [Refer Note 32.5 (c)] | 1,040 | 74,541 | 1,040 | 74,541 |
| Sub total | 9,586,053 | 4,377,014 | 9,586,053 | 4,377,014 |
| GROUP | BANK | |||
| As at December 31, | 2014 | 2013 | 2014 | 2013 |
| Rs. ’000 | Rs. ’000 | Rs. ’000 | Rs. ’000 | |
32.1 (c) By Industry (*) |
||||
| Agriculture and fishing | 45,451,951 | 38,013,743 | 45,306,783 | 38,013,743 |
| Manufacturing | 54,799,178 | 49,650,801 | 54,799,178 | 49,650,801 |
| Tourism | 18,306,599 | 14,242,671 | 18,273,643 | 14,242,671 |
| Transport | 13,294,127 | 10,157,863 | 13,241,354 | 10,174,829 |
| Construction | 42,546,071 | 35,601,502 | 42,525,815 | 35,601,502 |
| Trading | 62,280,308 | 52,367,237 | 62,017,576 | 52,367,237 |
| New economy | 6,533,193 | 6,440,151 | 6,533,193 | 6,440,151 |
| Financial and business services | 28,627,011 | 16,415,452 | 29,205,088 | 16,415,452 |
| Infrastructure | 15,729,998 | 12,814,953 | 15,729,998 | 12,814,953 |
| Other services | 40,676,423 | 30,420,543 | 40,424,390 | 30,420,543 |
| Government | 41,198,266 | 8,946,499 | 41,198,266 | 8,946,499 |
| Other customers | 95,456,253 | 104,166,022 | 94,331,013 | 104,164,516 |
| Sub total [Refer Note 32.1 (a)] | 464,899,378 | 379,237,437 | 463,586,297 | 379,252,897 |
(*) Industry-wise breakdown is provided only for loans and receivables.
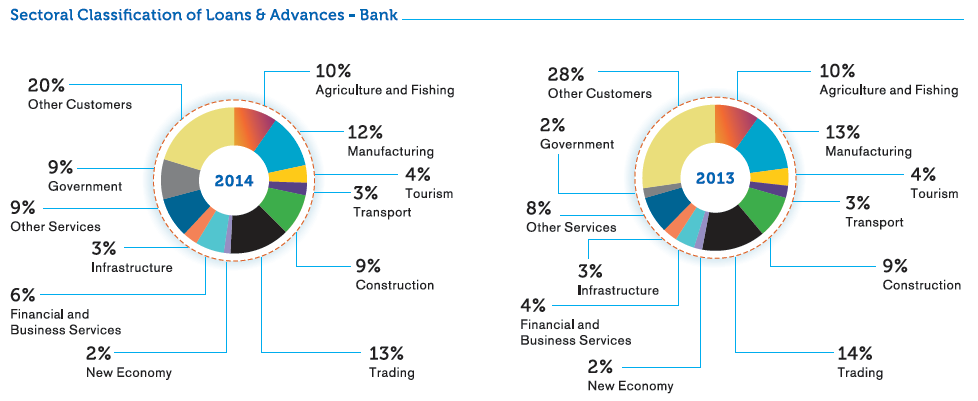
32.2 Movement in Provision for Individual and Collective Impairment during the Year
| GROUP | BANK | |||
| As at December 31, | 2014 | 2013 | 2014 | 2013 |
| Rs. ’000 | Rs. ’000 | Rs. ’000 | Rs. ’000 | |
| Movement in Provision for Individual Impairment | ||||
| Balance as at January 01, | 4,204,654 | 3,402,168 | 4,204,654 | 3,402,168 |
| Charge/(write back) to the Income Statement [Refer Note 17] | 390,003 | 1,070,253 | 390,003 | 1,070,253 |
| Net write-off/(recoveries) during the year | (403,411) | (369,740) | (403,411) | (369,740) |
| Exchange rate variance on foreign currency provisions | 6,765 | 18,792 | 6,765 | 18,792 |
| Interest accrued/(reversals) on impaired loans and advances | (278,878) | (304,712) | (278,878) | (304,712) |
| Other movements | 415,454 | 387,893 | 415,454 | 387,893 |
| Balance as at December 31, | 4,334,587 | 4,204,654 | 4,334,587 | 4,204,654 |
| Movement in Provision for Collective Impairment | ||||
| Balance as at January 01, | 11,582,515 | 10,099,059 | 11,582,514 | 10,099,059 |
| Balance assumed on business combination | 194,805 | – | – | – |
| Charge/(write back) to the Income Statement [Refer Note 17] | 4,480,932 | 4,007,742 | 4,462,289 | 4,007,742 |
| Net write-off/(recoveries) during the year | (3,422,651) | (2,527,827) | (3,422,651) | (2,527,828) |
| Exchange rate variance on foreign currency provisions | (165) | 3,541 | (165) | 3,541 |
| Other movements | – | – | – | – |
| Balance as at December 31, | 12,835,436 | 11,582,515 | 12,621,987 | 11,582,514 |
| Total of individual and collective impairment | 17,170,023 | 15,787,168 | 16,956,574 | 15,787,168 |
| GROUP | BANK | |||
| As at December 31, | 2014 | 2013 | 2014 | 2013 |
| Rs. ’000 | Rs. ’000 | Rs. ’000 | Rs. ’000 | |
32.3 Lease/Hire Purchase ReceivableGross Lease/Hire Purchase Receivable |
24,814,178 | 21,778,745 | 23,068,581 | 21,795,710 |
| Within one year [Refer Note 32.3 (a)] | 10,129,318 | 8,807,377 | 9,303,525 | 8,822,061 |
| From one to five years [Refer Note 32.3 (b)] | 14,676,651 | 12,966,406 | 13,756,847 | 12,968,687 |
| Over five years [Refer Note 32.3 (c)] | 8,209 | 4,962 | 8,209 | 4,962 |
| Less: Provision for Individual impairment [Refer Note 32.3 (d)] | 60,961 | 54,317 | 60,961 | 54,317 |
| Provision for Collective impairment [Refer Note 32.3 (e)] | 1,064,533 | 789,654 | 856,170 | 789,653 |
| Net lease/Hire purchase receivable | 23,688,684 | 20,934,774 | 22,151,450 | 20,951,740 |
32.4 Loans Granted from Investment Fund Account (IFA)
As per the guidelines issued by the Central Bank of Sri Lanka, Investment Fund Account was established effective from January 1, 2011 by transferring tax savings as explained below:
(a) 5 % of the Profits Before Tax (PBT) calculated for Income Tax (IT) purposes, on the dates of making Self-Assessment payments on IT.
(b) 8% of the profits calculated for the payment of Value Added Tax (VAT) on financial services at the time of making payments on VAT.
| As at December 31, | 2014 | 2013 |
| Rs. ’000 | Rs. ’000 | |
| Balance in IFA(*) | 5,126,108 | 4,838,694 |
| Capital outstanding of loans granted from IFA - [ Refer Note 32.4 (a)] | (4,377,318) | (3,396,973) |
| Amount Invested in Government Securities | 748,790 | 1,441,721 |
(* ) The requirement to maintain the Investment Fund Account ceased with effect from October 1, 2014 as per the instructions issued by the Central Bank of Sri Lanka.
32.4. (a) Capital Outstanding of Loans Granted from Investment Fund Account
| As at December 31, | 2014 | 2013 | ||||||
| Sector | Interest Rates |
Tenure | Amount Outstanding (A) |
Pending Disbursement (B) |
Total (A) + (B) |
Amount Outstanding (A) |
Pending Disbursement (B) |
Total (A) + (B) |
| (%) | (Years) | Rs. ’000 | Rs. ’000 | Rs. ’000 | Rs. ’000 | Rs. ’000 | Rs. ’000 | |
| (a) Cultivation of Plantation crops/Agriculture crops | 6.85 - 11.04 | 5 | 58,067 | 35,115 | 93,182 | 65,340 | 55,115 | 120,455 |
| (b) Factory/Mills modernisation/Establishment/Expansion | 6.85 - 12.54 | 5 | 445,247 | 51,800 | 497,047 | 485,588 | 49,300 | 534,888 |
| (c) Infrastructure Development | 8.87 - 13.57 | 14.5 | 3,861,496 | 402,017 | 4,263,614 | 2,767,945 | 1,559,669 | 4,327,614 |
| (d) Construction of Hotels and for related purposes | 7.35 - 12.79 | 7 | 12,508 | – | 12,508 | 78,100 | 142,583 | 220,683 |
| Capital Outstanding of the Loans granted | 4,377,318 | 488,932 | 4,866,351 | 3,396,973 | 1,806,667 | 5,203,640 | ||
| (e) Interest receivable | 177,102 | – | 177,102 | 123,438 | – | 123,438 | ||
| Carrying amount of the Loans granted |
4,554,420 | 488,932 | 5,043,453 | 3,520,411 | 1,806,667 | 5,327,078 | ||
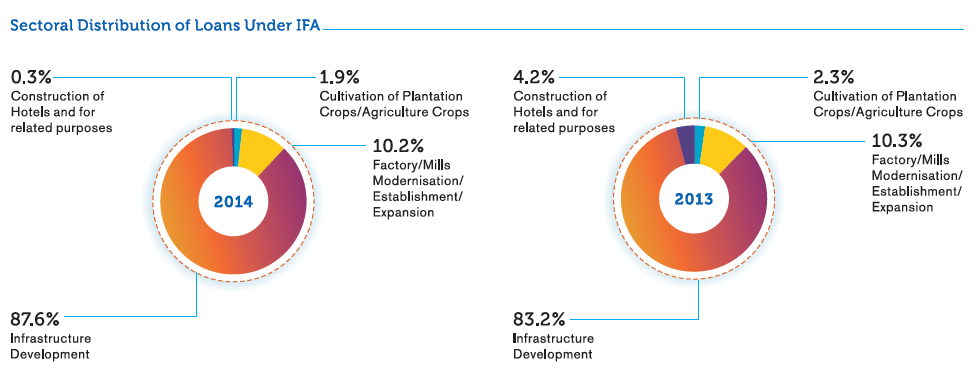
The above debentures are stated at amortised cost and classified under loans and receivables due to the absence of an active market.
32.6 Summary of Individually Impaired Loans and Receivables - Bank
| As at December 31, | 2014 | 2013 | ||
| Individually Impaired Loans and Receivables |
Individual Impairment |
Individually Impaired Loans and Receivables |
Individual Impairment |
|
| Rs. ’000 | Rs. ’000 | Rs. ’000 | Rs. ’000 | |
| Loans and Advances | ||||
| Overdrafts | 1,005,810 | 836,674 | 1,011,562 | 755,677 |
| Trade finance | 531,495 | 393,998 | 495,877 | 355,102 |
| Lease/hire purchase receivable | 107,219 | 60,961 | 135,148 | 54,317 |
| Credit cards | – | – | – | – |
| Pawning | 6,360 | 133 | – | – |
| Staff loans | – | – | – | – |
| Housing loans | 24,041 | 5,632 | 23,456 | 4,182 |
| Personal loans | 2,368 | 1,697 | 2,148 | 1,476 |
| Term loans | 4,871,389 | 3,035,493 | 5,134,833 | 3,033,900 |
| Bills of exchange | – | – | – | – |
| Securities purchased under resale agreements | – | – | – | – |
| Total impaired loans and advances | 6,548,682 | 4,334,588 | 6,803,024 | 4,204,654 |
| Other Receivables | ||||
| Government securities | – | – | – | – |
| Investments | – | – | – | – |
| Total impaired other receivables | – | – | – | – |
| Total impaired loans and receivables | 6,548,682 | 4,334,588 | 6,803,024 | 4,204,654 |
33. Financial Investments – Available-for-Sale
| GROUP | BANK | |||
| As at December 31, | 2014 | 2013 | 2014 | 2013 |
| Rs. ’000 | Rs. ’000 | Rs. ’000 | Rs. ’000 | |
| Government securities | 213,381,263 | 131,565,941 | 213,364,740 | 131,565,941 |
| Government securities - Sri Lanka [Refer Note 33.1 (a)] | 205,176,556 | 123,597,457 | 205,160,033 | 123,597,457 |
| Government securities - Bangladesh [Refer Note 33.1 (b)] | 8,204,707 | 7,968,484 | 8,204,707 | 7,968,484 |
| Equity securities [Refer Notes 33.2 and 33.3] | 230,313 | 190,584 | 230,189 | 190,584 |
| Quoted shares - (At mark to market value) [Refer Notes 33.2 (a) & 33.3 (a)] | 185,132 | 145,492 | 185,132 | 145,492 |
| Unquoted shares - (At cost) [Refer Notes 33.2 (b) & 33.3 (b)] | 45,181 | 45,092 | 45,057 | 45,092 |
| Investment in Unit Trust [Refer Note 33.4] | 613,441 | – | 613,441 | – |
| Total | 214,225,017 | 131,756,525 | 214,208,370 | 131,756,525 |
There were no impairment losses on Financial investments – Available-for-Sale as at December 31, 2014 (2013 - Nil).
The maturity analysis of Financial investments – Available-for-Sale is given in Note 58.
33.2 (a) Equity Securities – As at December 31, 2014
| GROUP | BANK | |||||||
| No. of Shares |
Market Price |
Market Value |
Cost of Investment |
No. of Shares |
Market Price |
Market Value |
Cost of Investment |
|
| Rs. | Rs. ’000 | Rs. ’000 | Rs. | Rs. ’000 | Rs. ’000 | |||
Sector/Type of Securities |
||||||||
| Quoted Shares: | ||||||||
| Bank, Finance and Insurance | ||||||||
| DFCC Bank PLC | 3,496 | 219.00 | 766 | 155 | 3,496 | 219.00 | 766 | 155 |
| Hatton National Bank PLC | 11,760 | 194.90 | 2,292 | 315 | 11,760 | 194.90 | 2,292 | 315 |
| Nations Trust Bank PLC | 1,333 | 97.00 | 129 | 22 | 1,333 | 97.00 | 129 | 22 |
| National Development Bank PLC | 5,424 | 250.00 | 1,356 | 215 | 5,424 | 250.00 | 1,356 | 215 |
| Sampath Bank PLC | 3,714 | 236.30 | 878 | 72 | 3,714 | 236.30 | 878 | 72 |
| Seylan Bank PLC | 1,015 | 95.00 | 96 | 24 | 1,015 | 95.00 | 96 | 24 |
| VISA Inc. | 4,856 | US$.262.20 | 168,259 | – | 4,856 | US$.262.20 | 168,259 | – |
| Sub total | 173,776 | 803 | 173,776 | 803 | ||||
| Manufacturing | ||||||||
| Alumex PLC | 714,200 | 15.90 | 11,356 | 9,999 | 714,200 | 15.90 | 11,356 | 9,999 |
| Sub total | 11,356 | 9,999 | 11,356 | 9,999 | ||||
| Total | 185,132 | 10,802 | 185,132 | 10,802 | ||||
33.2 (b) Equity Securities - As at December 31, 2014
| GROUP | BANK | |||||||
| No. of Shares |
Market Price |
Market Value |
Cost of Investment |
No. of Shares |
Market Price |
Market Value |
Cost of Investment |
|
| Rs. | Rs. ’000 | Rs. ’000 | Rs. | Rs. ’000 | Rs. ’000 | |||
Sector/Type of Securities |
||||||||
| Unquoted Shares: | ||||||||
| Bank, Finance and Insurance | ||||||||
| Central Depository of Bangladesh Ltd. | 3,427,083 | BDT 2.75 | 15,863 | 15,863 | 3,427,083 | BDT 2.75 | 15,863 | 15,863 |
| Credit Information Bureau of Sri Lanka | 5,637 | 100.00 | 564 | 564 | 4,400 | 100.00 | 440 | 440 |
| Fitch Ratings Lanka Ltd. | 62,500 | 10.00 | 625 | 625 | 62,500 | 10.00 | 625 | 625 |
| Lanka Clear (Pvt) Ltd. | 1,000,000 | 10.00 | 10,000 | 10,000 | 1,000,000 | 10.00 | 10,000 | 10,000 |
| Lanka Financial Service Bureau Ltd. | 225,000 | 10.00 | 2,250 | 2,250 | 225,000 | 10.00 | 2,250 | 2,250 |
| RAM Ratings ( Lanka ) Ltd. | 689,590 | 12.50 | 8,620 | 8,620 | 689,590 | 12.50 | 8,620 | 8,620 |
| Society for Worldwide Interbank Financial Telecommunication (SWIFT) | 47 | 154,446.00 | 7,259 | 7,259 | 47 | 154,446.00 | 7,259 | 7,259 |
| Total | 45,181 | 45,181 | 45,057 | 45,057 | ||||
33.2 (c) Sector/Industry Composition of the Equity Securities – As at December 31, 2014
| GROUP | Bank | |||
| Market Value |
Cost of Investment |
Market Value |
Cost of Investment |
|
| Rs. ’000 | Rs. ’000 | Rs. ’000 | Rs. ’000 | |
Sector/Industry |
||||
| Bank, Finance and Insurance | 218,957 | 45,984 | 218,833 | 45,860 |
| Manufacturing | 11,356 | 9,999 | 11,356 | 9,999 |
| Total | 230,313 | 55,983 | 230,189 | 55,859 |
33.3 (a) Equity Securities – As at December 31, 2013
33.3 (c) Sector/Industry Composition of the Equity Securities – As at December 31, 2013
| GROUP | BANK | |||
| Market Value |
Cost of Investment |
Market Value |
Cost of Investment |
|
| Rs. ’000 | Rs. ’000 | Rs. ’000 | Rs. ’000 | |
Sector/Industry |
||||
| Bank Finance and Insurance | 190,584 | 45,895 | 190,584 | 45,895 |
| Total | 190,584 | 45,895 | 190,584 | 45,895 |
33.4 Investment in Unit Trust – As at December 31, 2014
| GROUP | BANK | |||
| Market Value |
Cost of Investment |
Market Value |
Cost of Investment |
|
| Rs. ’000 | Rs. ’000 | Rs. ’000 | Rs. ’000 | |
Sector/Industry |
||||
| Bank, Finance and Insurance | ||||
| Capital Alliance Investment Ltd. | 613,441 | 613,441 | 613,441 | 613,441 |
| Total | 613,441 | 613,441 | 613,441 | 613,441 |
(2013 - Nil)
34. Investments in Subsidiaries
| GROUP | BANK | ||||||||
| As at December 31, | 2014 | 2013 | 2014 | 2013 | |||||
| Holding | Cost | Market Value/ Directors’ Valuation |
Cost | Market Value/ Directors’ Valuation |
Cost | Market Value/ Directors’ Valuation |
Cost | Market Value/ Directors’ Valuation |
|
| % | Rs. ’000 | Rs. ’000 | Rs. ’000 | Rs. ’000 | Rs. ’000 | Rs. ’000 | Rs. ’000 | Rs. ’000 | |
| Local Subsidiaries: | |||||||||
| Quoted: | |||||||||
| Commercial Development Company PLC | 94.55 | – | – | – | – | 274,393 | 1,145,916 | 274,393 | 752,220 |
| (11,345,705 Ordinary Shares) | (@ Rs. 101.00) | (@ Rs. 66.30) | |||||||
| (11,345,705 Ordinary Shares as at December 31, 2013) | |||||||||
| Unquoted: | |||||||||
| ONEzero Company Ltd. | 100 | – | – | – | – | 5,000 | 5,000 | 5,000 | 5,000 |
| (500,001 Ordinary Shares) | (@ Rs. 10.00) | (@ Rs. 10.00) | |||||||
| (500,001 Ordinary Shares as at December 31, 2013) |
|||||||||
| Indra Finance Ltd. | 100 | – | – | – | – | 916,046 | 916,046 | – | – |
| (21,600,000 Ordinary Shares) | |||||||||
| (2013 - Nil) | |||||||||
| Foreign Subsidiary: | |||||||||
| Unquoted: | |||||||||
| Commex - Sri Lanka S.R.L. (Incorporated in Italy) (*) | 100 | – | – | – | – | 129,928 | 15,561 | 95,133 | 9,553 |
| Gross Total | – | – | – | – | 1,325,367 | 2,082,523 | 374,526 | 766,773 | |
| Less: Provision for impairment [Refer Note 34.1] | – | – | – | – | (114,367) | – | (85,580) | – | |
| Net Total | – | – | – | – | 1,211,000 | 2,082,523 | 288,946 | 766,773 | |
(*) The Bank is yet to commence intended commercial operations in Italy and as such, made provisions for the expenses incurred on account of Italy operations before finalising the Bank‘s Financial Statements. All arrangements have been made to submit the new application to ‘Bank of Italy’ to obtain Money Transfer License and it is expected to commence commercial operations during 2015.
As set out above, the Bank does not have any subsidiaries with material non-controlling interest. Accordingly, no additional disclosures have been made as required by the SLFRS 12 on ‘Disclosure of Interest in Other Entities’.
34.1 Movement in Provision for Impairment o/a Subsidiaries during the Year
| GROUP | BANK | |||
| 2014 | 2013 | 2014 | 2013 | |
| Rs. ’000 | Rs. ’000 | Rs. ’000 | Rs. ’000 | |
| Balance as at January 01, | – | – | 85,580 | 71,396 |
| Charge/(Write back) to the Income Statement [Refer Note 17] | – | – | 28,787 | 14,184 |
| Balance as at December 31, | – | – | 114,367 | 85,580 |
34.2 Acquisition of Subsidiary
As per the Financial Sector Consolidation Road Map of the Central Bank of Sri Lanka, on September 01, 2014, the Bank acquired 100% ownership of Indra Finance Ltd., a Licensed Finance Company registered with the Central Bank of Sri Lanka for a total purchase consideration of Rs. 916.046 Mn. The Bank obtained all relevant regulatory approvals prior to acquisition of this Company.
34.2.1 Consideration Transferred
Total purchase consideration stated above was satisfied in the form of cash.
34.2.2 Identifiable Assets Acquired and Liabilities Assumed
The recognised amounts of assets acquired and liabilities assumed of Indra Finance Ltd. as at the date of acquisition were as follows:
| Fair Value Recognised on Acquisition Rs. ’000 |
|
| Assets | |
| Cash and cash equivalents | 24,576 |
| Government Securities | 17,618 |
| Financial investments – Available-for-sale | 124 |
| Property, plant & equipment and intangible assets (net) [Refer Notes 36.1 and 37.1] | 207,504 |
| Loans and receivables to other customers | 1,652,134 |
| Other assets | 24,355 |
| Sub Total | 1,926,311 |
| Liabilities | |
| Due to banks | (1,038,736) |
| Current tax liabilities [Refer Note 44] | (7,200) |
| Subordinated liabilities [Refer Note 49] | (215,000) |
| Provision for gratuity payable [Refer Note 47.1 (b)] | (1,977) |
| Deferred tax liabilities [Refer Note 45.1] | (47,292) |
| Other liabilities | (100,105) |
| Sub Total | (1,410,310) |
| Fair value of identifiable net assets at the date of acquisition | 516,001 |
Fair value of the land and buildings acquired was obtained using the valuations carried out by an independent professional valuer.
34.2.3 Goodwill
Goodwill arising from the acquisition has been recongnised as the excess of the consideration transferred over the net identifiable assets acquired and liabilities assumed.
| Rs. ’000 | |
| Consideration transferred [Refer Note 34.2] | 916,046 |
| Fair value of identifiable net assets at the date of acquisition [Refer Note 34.2.2] | (516,001) |
| Goodwill [Refer Note 37] | 400,045 |
34.2.4 Cost of acquisition of the subsidiary, net of cash acquired
| GROUP | BANK | |
| Rs. ’000 | Rs. ’000 | |
| Purchase consideration transferred [Refer Note 34.2] | 916,046 | 916,046 |
| Cash and cash equivalents acquired on business combination [Refer Note 34.2.2] | (24,576) | – |
| Cost of acquisition of the subsidiary, net of cash acquired | 891,470 | 916,046 |
35. Investments in Associates
| GROUP | BANK | ||||||||
| As at December 31, | 2014 | 2013 | 2014 | 2013 | |||||
| Holding | Cost | Market Value/ Directors’ Valuation |
Cost | Market Value/ Directors’ Valuation |
Cost | Market Value/ Directors’ Valuation |
Cost | Market Value/ Directors’ Valuation |
|
| % | Rs. ’000 | Rs. ’000 | Rs. ’000 | Rs. ’000 | Rs. ’000 | Rs. ’000 | Rs. ’000 | Rs. ’000 | |
| Unquoted: | |||||||||
| Equity Investments Lanka Ltd. | 22.92 | 44,331 | 72,134 | 44,331 | 60,411 | 44,331 | 72,134 | 44,331 | 60,411 |
| (4,110,938 Ordinary Shares) | |||||||||
| (4,110,938 Ordinary Shares as at December 31, 2013) | |||||||||
| Add: Share of profit applicable to the Bank: | |||||||||
| Balance as at January 01, | 16,080 | 18,380 | |||||||
| Current year’s share of profit/(loss) after tax | 5,108 | 1,911 | |||||||
| Other comprehensive income, net of tax | 6,615 | (2,132) | |||||||
| Less: Dividend received during the year | – | (2,079) | |||||||
| Current year’s retained profit | 11,723 | (2,300) | |||||||
| Balance as at December 31, | 27,803 | 16,080 | |||||||
| Total | 72,134 | 72,134 | 60,411 | 60,411 | 44,331 | 72,134 | 44,331 | 60,411 | |
| Commercial Insurance Brokers (Pvt) Ltd. | 18.91 | 100 | 34,153 | 100 | 33,762 | – | – | – | – |
| (120,000 Ordinary Shares) | |||||||||
| (120,000 Ordinary Shares as at December 31, 2013) | |||||||||
| Add: Share of profit applicable to the Bank: | |||||||||
| Balance as at January 01, | 33,662 | 30,901 | |||||||
| Current year’s share of profit after tax | 1,455 | 3,374 | |||||||
| Other comprehensive income, net of tax | (213) | – | |||||||
| Less: Dividend received during the year | (851) | (613) | |||||||
| Current year’s retained profit | 391 | 2,761 | |||||||
| Balance as at December 31, | 34,053 | 33,662 | |||||||
| Total | 34,153 | 34,153 | 33,762 | 33,762 | – | – | – | – | |
| Total value of Investments in unquoted associates at carrying value on equity basis | 106,287 | 94,173 | 44,331 | 44,331 | |||||
| Less: provision for impairment | – | – | – | – | |||||
| Net Total | 106,287 | 94,173 | 44,331 | 44,331 | |||||
| Total Market Value/Directors’ Valuation of Investments in Associates | 106,287 | 94,173 | 72,134 | 60,411 | |||||
The Group recognises the share of net assets of the associates under the Equity Method to arrive at the Directors’ valuation.
The maturity analysis of Investments in Associates is given in Note 58.
36. Property, Plant & Equipment
36.1 Group – 2014
| Freehold Land |
Freehold Buildings |
Leasehold Buildings |
Computer Equipment |
Motor Vehicles |
Office Equipment - Furniture & Fixtures |
Capital Work-in- Progress |
Total 2014 |
Total 2013 |
|
| Rs. ’000 | Rs. ’000 | Rs. ’000 | Rs. ’000 | Rs.’000 | Rs. ’000 | Rs. ’000 | Rs. ’000 | Rs. ’000 | |
| Cost/Valuation | |||||||||
| Balance as at January 01, | 3,554,398 | 2,230,019 | 838,626 | 3,388,112 | 331,862 | 3,854,867 | 251,163 | 14,449,047 | 13,749,615 |
| Property, Plant & Equipment acquired on business combination | 86,000 | 91,000 | – | 9,473 | 12,341 | 17,354 | – | 216,168 | – |
| Additions during the year | 52,399 | 3,558 | – | 273,961 | 81,407 | 503,955 | 205,302 | 1,120,582 | 959,019 |
| Transfer of accumulated depreciation on assets revalued | – | (206,238) | (37,634) | – | – | – | – | (243,872) | – |
| Surplus on revaluation of property | 1,190,476 | 431,013 | 191,268 | – | – | – | – | 1,812,757 | – |
| Disposals during the year | – | – | (134) | (147,082) | (97,746) | (246,935) | – | (491,897) | (281,871) |
| Exchange rate variance | – | – | – | (254) | (102) | (3,217) | – | (3,573) | 24,210 |
| Transfers/adjustments | – | – | – | (5,491) | – | 5,491 | (48,260) | (48,260) | (1,926) |
| Balance as at December 31, | 4,883,273 | 2,549,352 | 992,126 | 3,518,719 | 327,762 | 4,131,515 | 408,205 | 16,810,952 | 14,449,047 |
| Accumulated Depreciation and Impairment Losses | |||||||||
| Balance as at January 01, | – | 136,854 | 49,119 | 2,558,152 | 236,022 | 2,293,675 | – | 5,273,822 | 4,802,734 |
| Accumulated depreciation assumed on business combination | – | – | – | 4,725 | 6,728 | 5,615 | – | 17,068 | – |
| Charge for the year [Refer Note 19] | – | 69,992 | 22,884 | 306,632 | 41,090 | 646,577 | – | 1,087,175 | 717,583 |
| Impairment loss | – | – | – | – | – | – | – | – | – |
| Transfer of accumulated depreciation on assets revalued | – | (206,238) | (37,634) | – | – | – | – | (243,872) | – |
| Disposals during the year | – | – | – | (144,656) | (78,560) | (233,146) | – | (456,362) | (261,555) |
| Exchange rate variance | – | – | – | (207) | (87) | (1,446) | – | (1,740) | 15,119 |
| Transfers/adjustments | – | – | – | (5,359) | – | 5,359 | – | – | (59) |
| Balance as at December 31, | – | 608 | 34,369 | 2,719,287 | 205,193 | 2,716,634 | – | 5,676,091 | 5,273,822 |
| Net book value as at December 31, 2014 | 4,883,273 | 2,548,744 | 957,757 | 799,432 | 122,569 | 1,414,881 | 408,205 | 11,134,861 | |
| Net book value as at December 31, 2013 | 3,554,398 | 2,093,165 | 789,507 | 829,960 | 95,840 | 1,561,192 | 251,163 | 9,175,225 |
36.2 Group – 2013
| Freehold Land |
Freehold Buildings |
Leasehold Buildings |
Computer Equipment |
Motor Vehicles |
Office Equipment - Furniture & Fixtures |
Capital Work-in- Progress |
Total 2013 |
Total 2012 |
|
| Rs. ’000 | Rs. ’000 | Rs. ’000 | Rs. ’000 | Rs. ’000 | Rs. ’000 | Rs. ’000 | Rs. ’000 | Rs. ’000 | |
| Cost/Valuation | |||||||||
| Balance as at January 01, | 3,502,740 | 2,209,630 | 838,626 | 3,170,031 | 367,490 | 3,542,095 | 119,003 | 13,749,615 | 12,719,314 |
| Additions during the year | 51,658 | 20,389 | – | 348,577 | 20,858 | 384,674 | 132,863 | 959,019 | 1,260,079 |
| Surplus on revaluation of property | – | – | – | – | – | – | – | – | 192,237 |
| Disposals during the year | – | – | – | (137,017) | (58,843) | (86,011) | – | (281,871) | (396,409) |
| Exchange rate variance | – | – | – | 6,580 | 2,357 | 13,874 | 1,399 | 24,210 | 58,524 |
| Transfers/adjustments | – | – | – | (59) | – | 235 | (2,102) | (1,926) | (84,130) |
| Balance as at December 31, | 3,554,398 | 2,230,019 | 838,626 | 3,388,112 | 331,862 | 3,854,867 | 251,163 | 14,449,047 | 13,749,615 |
| Accumulated Depreciation and Impairment Losses | |||||||||
| Balance as at January 01, | – | 67,722 | 146,515 | 2,351,033 | 236,328 | 2,001,136 | – | 4,802,734 | 4,216,103 |
| Charge for the year [Refer Note 19] | – | 69,132 | (97,396) | 337,730 | 48,169 | 359,948 | – | 717,583 | 942,765 |
| Impairment loss | – | – | – | – | – | – | – | – | – |
| Disposals during the year | – | – | – | (136,262) | (50,221) | (75,072) | – | (261,555) | (336,079) |
| Exchange rate variance | – | – | – | 5,710 | 1,746 | 7,663 | – | 15,119 | 31,849 |
| Transfers/adjustments | – | – | – | (59) | – | – | – | (59) | (51,904) |
| Balance as at December 31, | – | 136,854 | 49,119 | 2,558,152 | 236,022 | 2,293,675 | – | 5,273,822 | 4,802,734 |
| Net book value as at December 31, 2013 | 3,554,398 | 2,093,165 | 789,507 | 829,960 | 95,840 | 1,561,192 | 251,163 | 9,175,225 | |
| Net book value as at December 31, 2012 | 3,502,740 | 2,141,908 | 692,111 | 818,998 | 131,162 | 1,540,959 | 119,003 | 8,946,881 |
There were no capitalised borrowing cost related to the acquisition of property, plant & equipment during the year 2014 (2013 - Nil).
The carrying amount of Group’s revalued assets that would have been included in the Financial Statements had the assets been carried at cost less depreciation/amortisation is as follows:
| As at December 31, | 2014 | 2013 | ||||
| Cost | Accumulated Depreciation |
Net Book Value |
Cost | Accumulated Depreciation |
Net Book Value |
|
| Rs. ’000 | Rs. ’000 | Rs. ’000 | Rs. ’000 | Rs. ’000 | Rs. ’000 | |
| Class of Asset | ||||||
| Freehold land | 711,720 | – | 711,720 | 608,588 | – | 608,588 |
| Freehold buildings | 1,080,035 | 298,287 | 781,748 | 1,027,212 | 269,653 | 757,559 |
| Leasehold buildings | 259,625 | 144,490 | 115,135 | 259,759 | 136,567 | 123,192 |
| Total | 2,051,380 | 442,777 | 1,608,603 | 1,895,559 | 406,220 | 1,489,339 |
36.3 Bank – 2014
| Freehold Land |
Freehold Buildings |
Leasehold Buildings |
Computer Equipment |
Motor Vehicles |
Office Equipment - Furniture & Fixtures |
Capital Work-in- Progress |
Total 2014 |
Total 2013 |
|
| Rs. ’000 | Rs. ’000 | Rs. ’000 | Rs. ’000 | Rs. ’000 | Rs. ’000 | Rs. ’000 | Rs. ’000 | Rs. ’000 | |
| Cost/Valuation | |||||||||
| Balance as at January 01, | 3,554,398 | 2,230,019 | 104,625 | 3,383,183 | 146,484 | 3,851,453 | 229,365 | 13,499,527 | 12,747,986 |
| Additions during the year | 52,399 | 3,558 | – | 273,109 | 637 | 485,307 | 205,302 | 1,020,312 | 958,204 |
| Transfer of accumulated depreciation on assets revalued | – | (206,238) | – | – | – | – | – | (206,238) | – |
| Surplus on revaluation of property | 1,190,476 | 431,013 | – | – | – | – | – | 1,621,489 | – |
| Disposals during the year | – | – | – | (146,255) | (17,972) | (246,316) | – | (410,543) | (227,463) |
| Exchange rate variance | – | – | – | (254) | (102) | (648) | – | (1,004) | 22,726 |
| Transfers/adjustments | – | – | – | (5,491) | – | 5,491 | (30,448) | (30,448) | (1,926) |
| Balance as at December 31, | 4,797,273 | 2,458,352 | 104,625 | 3,504,292 | 129,047 | 4,095,287 | 404,219 | 15,493,095 | 13,499,527 |
| Accumulated Depreciation and Impairment Losses | |||||||||
| Balance as at January 01, | – | 136,854 | 30,769 | 2,555,449 | 97,087 | 2,292,024 | – | 5,112,183 | 4,526,868 |
| Charge for the year [Refer Note 19] | – | 69,384 | 3,599 | 305,358 | 17,945 | 630,444 | – | 1,026,730 | 786,024 |
| Impairment loss | – | – | – | – | – | – | – | – | – |
| Transfer of accumulated depreciation on assets revalued | – | (206,238) | – | – | – | – | – | (206,238) | – |
| Disposals during the year | – | – | – | (143,926) | (15,484) | (232,568) | – | (391,978) | (215,769) |
| Exchange rate variance | – | – | – | (207) | (87) | (399) | – | (693) | 15,119 |
| Transfers/adjustments | – | – | – | (5,359) | – | 5,359 | – | – | (59) |
| Balance as at December 31, | – | – | 34,368 | 2,711,315 | 99,461 | 2,694,860 | – | 5,540,004 | 5,112,183 |
| Net book value as at December 31, 2014 | 4,797,273 | 2,458,352 | 70,257 | 792,977 | 29,586 | 1,400,427 | 404,219 | 9,953,091 | |
| Net book value as at December 31, 2013 | 3,554,398 | 2,093,165 | 73,856 | 827,734 | 49,397 | 1,559,429 | 229,365 | 8,387,344 |
36.4 Bank – 2013
| Freehold Land |
Freehold Buildings |
Leasehold Buildings |
Computer Equipment |
Motor Vehicles |
Office Equipment - Furniture & Fixtures |
Capital Work-in- Progress |
Total 31.12.2013 |
Total 31.12.2012 |
|
| Rs. ’000 | Rs. ’000 | Rs. ’000 | Rs. ’000 | Rs. ’000 | Rs. ’000 | Rs. ’000 | Rs. ’000 | Rs. ’000 | |
| Cost/Valuation | |||||||||
| Balance as at January 01, | 3,502,740 | 2,209,630 | 104,625 | 3,165,537 | 127,704 | 3,539,146 | 98,604 | 12,747,986 | 11,793,172 |
| Additions during the year | 51,658 | 20,389 | – | 348,142 | 20,858 | 384,294 | 132,863 | 958,204 | 1,197,639 |
| Disposals during the year | – | – | – | (137,017) | (4,435) | (86,011) | – | (227,463) | (266,664) |
| Exchange rate variance | – | – | – | 6,580 | 2,357 | 13,789 | – | 22,726 | 55,788 |
| Transfers/adjustments | – | – | – | (59) | – | 235 | (2,102) | (1,926) | (31,949) |
| Balance as at December 31, | 3,554,398 | 2,230,019 | 104,625 | 3,383,183 | 146,484 | 3,851,453 | 229,365 | 13,499,527 | 12,747,986 |
| Accumulated Depreciation and Impairment Losses | |||||||||
| Balance as at January 01, | – | 67,722 | 27,170 | 2,348,915 | 83,297 | 1,999,764 | – | 4,526,868 | 3,886,142 |
| Charge for the year [Refer Note 19] | – | 69,132 | 3,599 | 337,145 | 16,479 | 359,669 | – | 786,024 | 859,675 |
| Impairment loss | – | – | – | – | – | – | – | – | – |
| Disposals during the year | – | – | – | (136,262) | (4,435) | (75,072) | – | (215,769) | (251,075) |
| Exchange rate variance | – | – | – | 5,710 | 1,746 | 7,663 | – | 15,119 | 31,849 |
| Transfers/adjustments | – | – | – | (59) | – | – | – | (59) | 277 |
| Balance as at December 31, | – | 136,854 | 30,769 | 2,555,449 | 97,087 | 2,292,024 | – | 5,112,183 | 4,526,868 |
| Net book value as at December 31, 2013 | 3,554,398 | 2,093,165 | 73,856 | 827,734 | 49,397 | 1,559,429 | 229,365 | 8,387,344 | |
| Net book value as at December 31, 2012 | 3,502,740 | 2,141,908 | 77,455 | 816,622 | 44,407 | 1,539,382 | 98,604 | 8,221,118 |
There were no capitalised borrowing costs related to the acquisition of property, plant & equipment during the year 2014 (2013 - Nil).
The carrying amount of Bank’s revalued assets that would have been included in the Financial Statements had the assets been carried at cost less depreciation/amortisation is as follows:
| As at December 31, | 2014 | 2013 | ||||
| Cost | Accumulated Depreciation |
Net Book Value |
Cost | Accumulated Depreciation |
Net Book Value |
|
| Rs. ’000 | Rs. ’000 | Rs. ’000 | Rs. ’000 | Rs. ’000 | Rs. ’000 | |
| Class of Asset | ||||||
| Freehold land | 660,987 | – | 660,987 | 608,588 | – | 608,588 |
| Freehold buildings | 1,030,770 | 295,422 | 735,348 | 1,027,212 | 269,653 | 757,559 |
| Leasehold buildings | 102,726 | 41,005 | 61,721 | 102,726 | 38,437 | 64,289 |
| Total | 1,794,483 | 336,427 | 1,458,056 | 1,738,526 | 308,090 | 1,430,436 |
The maturity analysis of Property, Plant & Equipment is given in Note 58.
36.5 (a) Information on Freehold Land and Buildings of the Bank - Extents and Locations
[As required by Rule No. 7.6 (viii) of the ‘Continuing Listing Requirements’ of the Colombo Stock Exchange]
| Location | Extent (Perches) |
Buildings (Square Feet) |
Revalued Amounts Land Rs. ’000 |
Revalued Amounts Buildings Rs. ’000 |
Net Book Value/ Revalued Rs. ’000 |
Net Book Value before Revaluation Rs. ’000 |
| CEO’s Bungalow - No. 27, Queens Road, Colombo 3 | 64 | 5,616 | 544,850 | 15,150 | 560,000 | 421,459 |
| Holiday Bungalow - Bandarawela Ambatenne Estate, Bandarawela |
423 | 5,649 | 56,700 | 11,400 | 68,100 | 61,436 |
| Holiday Bungalow - Haputale No. 23, Lily Avenue, Welimada Road, Haputale |
258 | 5,662 | 30,900 | 15,300 | 46,200 | 38,713 |
| Branch Buildings | ||||||
| Battaramulla - No. 213, Kaduwela Road, Battaramulla | 14 | 11,216 | 52,500 | 87,375 | 139,875 | 79,866 |
| Battaramulla - No. 213, Kaduwela Road, Battaramulla | 13 | Bare Land | 50,000 | – | 50,000 | 52,399 |
| Borella - No. 92, D.S. Senanayake Mawatha, Borella, Colombo 8 | 16 | 16,880 | 156,300 | 198,700 | 355,000 | 126,331 |
| Chilaw - No. 44, Colombo Road, Chilaw | 35 | 9,420 | 63,522 | 38,000 | 101,522 | 126,541 |
| Galewela - No. 49/57, Matale Road, Galewela | 99 | 18,472 | 22,275 | 15,225 | 37,500 | 32,012 |
| Galle City - No. 130, Main Street, Galle | 7 | 3,675 | 40,500 | 8,269 | 48,769 | 40,277 |
| Galle Fort - No. 22, Church Street, Fort, Galle | 100 | 11,625 | 210,000 | 40,000 | 250,000 | 146,256 |
| Gampaha - No. 51, Queen Mary’s Road, Gampaha | 33 | 4,685 | 57,575 | 10,541 | 68,116 | 61,463 |
| Hikkaduwa - No. 217, Galle Road, Hikkaduwa | 37 | 6,713 | 26,370 | 24,608 | 50,978 | 37,518 |
| Ja-Ela - No. 140, Negombo Road, Ja-Ela | 13 | 7,468 | 29,000 | 21,000 | 50,000 | 38,741 |
| Jaffna - No. 474, Hospital Road, Jaffna | 77 | 5,146 | 581,000 | 19,000 | 600,000 | 283,456 |
| Kandy - No. 120, Kotugodella Veediya, Kandy | 45 | 44,500 | 354,000 | 231,000 | 585,000 | 549,953 |
| Kegalle - No. 186, Main Street, Kegalle | 85 | 2,650 | 128,000 | 7,000 | 135,000 | 121,300 |
| Keyzer Street - No. 32, Keyzer Street, Colombo 11 | 7 | 6,100 | 56,000 | 26,000 | 82,000 | 68,128 |
| Kollupitiya - No. 285, Galle Road, Colombo 3 | 17 | 16,254 | 115,000 | 65,000 | 180,000 | 158,283 |
| Kotahena - No. 198, George R. De Silva Mawatha, Kotahena, Colombo 13 |
28 | 26,722 | 140,000 | 207,400 | 347,400 | 314,958 |
| Kurunegala - No. 4, Suratissa Mawatha, Kurunegala | 50 | 9,821 | 199,325 | 34,675 | 234,000 | 218,636 |
| Maharagama - No. 154, High Level Road, Maharagama | 18 | 8,440 | 53,250 | 31,750 | 85,000 | 101,015 |
| Matale - No. 70, King Street, Matale | 51 | 8,596 | 75,000 | 60,000 | 135,000 | 117,358 |
| Matara - No. 18, Station Road, Matara | 37 | 8,137 | 50,695 | 25,291 | 75,986 | 50,470 |
| Minuwangoda - No. 42, Siriwardena Mawatha, Minuwangoda | 25 | 5,550 | 31,250 | 17,690 | 48,940 | 71,655 |
| Mutwal - No. 160, St. James Street, Colombo 15 | 17 | Bare Land | 34,000 | – | 34,000 | 22,300 |
| Narahenpita - No. 201, Kirula Road, Narahenpita, Colombo 5 | 22 | 11,193 | 132,300 | 87,700 | 220,000 | 162,939 |
| Narammala - No. 55, Negombo Road, Narammala | 42 | 5,353 | 53,391 | 16,609 | 70,000 | 58,843 |
| Negombo - No. 24, 26, Fernando Avenue, Negombo | 37 | 11,360 | 73,000 | 31,000 | 104,000 | 73,940 |
| Nugegoda - No. 100, Stanley Thilakaratne Mawatha, Nugegoda | 39 | 11,150 | 156,000 | 41,000 | 197,000 | 234,221 |
| Nuwara Eliya - No. 36, Buddhajayanthi Mawatha, Nuwara-Eliya | 42 | 10,184 | 82,000 | 71,000 | 153,000 | 135,834 |
| Panadura - No. 375, Galle Road, Panadura | 12 | 6,168 | 30,750 | 40,090 | 70,840 | 35,236 |
| Pettah - People’s Park Shopping Complex, Colombo 11 | – | 3,147 | – | 58,000 | 58,000 | 45,723 |
| Pettah - Stores - People’s Park Shopping Complex, Colombo 11 | – | 225 | – | 4,800 | 4,800 | 3,521 |
| Pettah - Main Street - No. 280, Main Street, Pettah, Colombo 11 | 20 | 22,760 | 280,000 | 69,299 | 349,299 | 238,670 |
| Trincomalee - No. 474, Power House Road, Trincomalee | 100 | Bare Land | 90,300 | – | 90,300 | 75,000 |
| Union Place - No. 1, Union Place, Colombo 2 | 30 | 63,385 | 450,000 | 750,000 | 1,200,000 | 936,148 |
| Wellawatte - No. 343, Galle Road, Colombo 6 | 45 | 15,050 | 249,520 | 50,480 | 300,000 | 235,222 |
| Wennappuwa - No. 262, 264, Colombo Road, Wennappuwa | 36 | 9,226 | 42,000 | 28,000 | 70,000 | 58,315 |
| Total | 4,797,273 | 2,458,352 | 7,255,625 | 5,634,136 |
36.5 (b) Information on Valuations of Freehold Land and Buildings of the Bank
[As required by Rule No. 7.6 (viii) of the ‘Continuing Listing Requirements’ of the Colombo Stock Exchange and the SLFRS 13 on ‘Fair Value Measurement’]
Date of Valuation: December 31, 2014
| Name of Professional Valuer/Location and Address | Method of Valuation and Significant Unobservable Inputs | Range of Estimates for Unobservable Inputs | Net Book Value before Revaluation of | Revalued Amount of | Revaluation Gain/(Loss) Recognised on | |||
| Land | Buildings | Land | Buildings | Land | Buildings | |||
| Rs. ’000 | Rs. ’000 | Rs. ’000 | Rs. ’000 | Rs. ’000 | Rs. ’000 | |||
| Mr. H.M.N. Herath | ||||||||
| Chilaw No. 44, Colombo Road, Chilaw |
Market comparable method | 61,750 | 64,791 | 63,522 | 38,000 | 1,772 | (26,791) | |
|
Rs. 1,800,000 p.p. | |||||||
|
Rs. 4,250 p.sq.ft. | |||||||
|
5% | |||||||
| Gampaha No. 51, Queen Mary’s Road Gampaha |
Market comparable method | 51,658 | 9,805 | 57,575 | 10,541 | 5,917 | 736 | |
|
Rs. 1,750,000 p.p. | |||||||
|
Rs. 3,750 p.sq.ft. | |||||||
|
40% | |||||||
| Minuwangoda No. 42, Siriwardena Mw., Minuwangoda |
Market comparable method | 37,500 | 34,155 | 31,250 | 17,690 | (6,250) | (16,465) | |
|
Rs. 1,250,000 p.p. | |||||||
|
Rs. 4,250 p.sq.ft. | |||||||
|
25% | |||||||
| Mr. K.C.B. Condegama | ||||||||
| Maharagama No. 154, Highlevel Road, Maharagama |
Market comparable method | 62,125 | 38,890 | 53,250 | 31,750 | (8,875) | (7,140) | |
|
Rs. 3,000,000 p.p. | |||||||
|
Rs. 3,750 p.sq.ft. | |||||||
| Nugegoda No. 100, Stanley Thilakaratne Mw., Nugegoda |
Market comparable method | 195,000 | 39,221 | 156,000 | 41,000 | (39,000) | 1,779 | |
|
Rs. 4,000,000 p.p. | |||||||
|
Rs. 3,800 p.sq.ft. | |||||||
| Wellawatte No. 343, Galle Road, Colombo 6 |
Market comparable method | 204,100 | 31,122 | 249,520 | 50,480 | 45,420 | 19,358 | |
|
Rs. 5,000,000 to Rs. 6,000,000 p.p. | |||||||
|
Rs. 3,800 p.sq.ft. | |||||||
| Mr. P.B. Kalugalagedara | ||||||||
| Keyzer Street No. 32, Keyzer Street, Colombo 11 |
Market comparable method | 45,000 | 23,128 | 56,000 | 26,000 | 11,000 | 2,872 | |
|
Rs. 7,500,000 p.p. | |||||||
|
Rs. 500 to Rs. 6,000 p.sq.ft. | |||||||
| Kollupitiya No. 285, Galle Road, Colombo 3 |
Market comparable method | 100,000 | 58,283 | 115,000 | 65,000 | 15,000 | 6,717 | |
|
Rs. 7,500,000 p.p. | |||||||
|
Rs. 1,250 to Rs. 5,000 p.sq.ft. | |||||||
| Kotahena No. 198, George R. De Silva Mw., Kotahena, Colombo 13 |
Market comparable method | 110,000 | 204,958 | 140,000 | 207,400 | 30,000 | 2,442 | |
|
Rs. 5,000,000 p.p. | |||||||
|
Rs. 1,000 to Rs. 7,750 p.sq.ft. | |||||||
| Mutwal No. 160, St. James Street, Colombo 15 |
Market comparable method | 22,300 | – | 34,000 | – | 11,700 | – | |
|
Rs. 2,000,000 p.p. | |||||||
| Mr. R.S. Wijesuriya | ||||||||
| Battaramulla No. 213, Kaduwela Road, Battaramula |
Market comparable method | 24,518 | 55,348 | 52,500 | 87,375 | 27,982 | 32,027 | |
|
Rs. 3,750,000 p.p. | |||||||
|
Rs. 7,500 p.sq.ft. | |||||||
| Battaramulla No. 213, Kaduwela Road, Battaramula |
Market comparable method | 52,399 | – | 50,000 | – | (2,399) | – | |
|
Rs. 3,750,000 p.p. | |||||||
| Panadura No. 375, Galle Road, Panadura |
Market comparable method | 18,450 | 16,787 | 30,750 | 40,090 | 12,300 | 23,303 | |
|
Rs. 2,500,000 p.p. | |||||||
|
Rs. 6,500 p.sq.ft. | |||||||
| Mr. S.A.S. Fernando | ||||||||
| Galle City No. 130, Main Street, Galle |
Market comparable method | 33,750 | 6,527 | 40,500 | 8,269 | 6,750 | 1,742 | |
|
Rs. 6,000,000 p.p. | |||||||
|
Rs. 2,250 p.sq.ft. | |||||||
| Galle Fort No. 22, Church Street, Fort, Galle |
Market comparable method | 100,000 | 46,256 | 210,000 | 40,000 | 110,000 | (6,256) | |
|
Rs. 2,100,000 p.p. | |||||||
|
Rs. 3,440 p.sq.ft. | |||||||
| Hikkaduwa No. 217, Galle Road, Hikkaduwa |
Market comparable method | 16,740 | 20,778 | 26,370 | 24,608 | 9,630 | 3,830 | |
|
Rs. 500,000 to Rs. 850,000 p.p. | |||||||
|
Rs. 2,750 to Rs. 3,500 p.sq.ft. | |||||||
| Matara No. 18, Station Road, Matara |
Market comparable method | 28,154 | 22,315 | 50,695 | 25,291 | 22,541 | 2,976 | |
|
Rs. 750,000 to Rs. 1,750,000 p.p. | |||||||
|
Rs. 2,750 to Rs. 3,500 p.sq.ft. | |||||||
| Trincomalee No. 474, Power House Road, Trincomalee |
Market comparable method | 75,000 | – | 90,300 | – | 15,300 | – | |
|
Rs. 900,000 p.p. | |||||||
| Mr. S.T. Sanmuganathan | ||||||||
| Jaffna No. 474, Hospital Road, Jaffna |
Investment method | 272,135 | 11,321 | 581,000 | 19,000 | 308,865 | 7,679 | |
|
Rs. 7,500,000 p.m. | |||||||
|
10 | |||||||
|
2 months p.a. | |||||||
| Mr. Sarath G. Fernando | ||||||||
| Holiday Bungalow - Bandarawela Ambatenne Estate, Bandarawela |
Market comparable method | 51,400 | 10,036 | 56,700 | 11,400 | 5,300 | 1,364 | |
|
Rs. 50,000 to Rs. 200,000 p.p. | |||||||
|
Rs. 3,750 to Rs. 4,500 p.sq.ft. | |||||||
|
50% | |||||||
| Holiday Bungalow - Haputale No. 23, Lily Avenue, Welimada Road, Haputale |
Market comparable method | 25,700 | 13,013 | 30,900 | 15,300 | 5,200 | 2,287 | |
|
Rs. 150,000 p.p. | |||||||
|
Rs. 3,250 to Rs. 6,500 p.sq.ft. | |||||||
|
20% to 55% | |||||||
| Kandy No. 120, Kotugodella Veediya, Kandy |
Market comparable method | 342,000 | 207,953 | 354,000 | 231,000 | 12,000 | 23,047 | |
|
Rs. 8,500,000 p.p. | |||||||
|
Rs. 5,750 to Rs. 9,500 p.sq.ft. | |||||||
|
30% & 35% | |||||||
| Kegalle No.186, Main Street, Kegalle |
Market comparable method | 115,000 | 6,300 | 128,000 | 7,000 | 13,000 | 700 | |
|
Rs. 1,000,000 to Rs. 2,500,000 p.p. | |||||||
|
Rs. 5,500 p.sq.ft. | |||||||
|
50% | |||||||
| Matale No. 70, King Street, Matale |
Market comparable method | 60,000 | 57,358 | 75,000 | 60,000 | 15,000 | 2,642 | |
|
Rs. 1,500,000 p.p. | |||||||
|
Rs. 8,750 p.sq.ft. | |||||||
|
20% | |||||||
| Nuwara-Eliya No. 36/3, Buddha Jayanthi Mawatha, Nuwara-Eliya |
Market comparable method | 72,000 | 63,834 | 82,000 | 71,000 | 10,000 | 7,166 | |
|
Rs. 1,000,000 to Rs. 2,000,000 p.p. | |||||||
|
Rs. 8,750 p.sq.ft. | |||||||
|
20% | |||||||
| Mr. Siri Nissanka | ||||||||
| Borella No. 92, D.S. Senanayake Mw., Colombo 08. |
Market comparable method | 70,335 | 55,996 | 156,300 | 198,700 | 85,965 | 142,704 | |
|
Rs. 10,000,000 p.p. | |||||||
|
Rs. 11,000 p.sq.ft. | |||||||
| CEO’s Bungalow No. 27, Queens Road, Colombo 03 |
Market comparable method | 416,650 | 4,809 | 544,850 | 15,150 | 128,200 | 10,341 | |
|
Rs. 8,500,000 p.p. | |||||||
|
Rs. 2,750 p.sq.ft. | |||||||
| Narahenpita No. 201, Kirula Road, Narahenpita, Colombo 05 |
Market comparable method | 99,225 | 63,714 | 132,300 | 87,700 | 33,075 | 23,986 | |
|
Rs. 6,000,000 p.p. | |||||||
|
Rs. 7,850 p.sq.ft. | |||||||
| Pettah-Main Street No. 280, Main Street, Pettah, Colombo 11 |
Market comparable method | 169,370 | 69,299 | 280,000 | 69,299 | 110,630 | – | |
|
Rs. 14,000,000 p.p. | |||||||
| Union Place No. 1, Union Place, Colombo 02 |
Market comparable method | 360,000 | 576,148 | 450,000 | 750,000 | 90,000 | 173,852 | |
|
Rs. 15,000,000 p.p. | |||||||
|
Rs. 12,000 p.sq.ft. | |||||||
| Mr. W.D.P. Rupananda | ||||||||
| Ja-Ela No. 140, Negombo Road, Ja-Ela |
Market comparable method | 23,188 | 15,554 | 29,000 | 21,000 | 5,812 | 5,446 | |
|
Rs. 2,250,000 p.p. | |||||||
|
Rs. 3,500 to Rs. 4,500 p.sq.ft. | |||||||
|
30% | |||||||
| Negombo No. 24, 26, Fernando Avenue, Negombo |
Market comparable method | 49,500 | 24,440 | 73,000 | 31,000 | 23,500 | 6,560 | |
|
Rs. 1,500,000 to Rs. 2,200,000 p.p. | |||||||
|
Rs. 3,500 to Rs. 4,250 p.sq.ft. | |||||||
|
25% | |||||||
| Pettah People’s Park Shopping Complex, Colombo 11 |
Investment method | – | 45,723 | – | 58,000 | – | 12,277 | |
|
Rs. 23,200 to Rs. 160,000 p.m. | |||||||
|
18.18 | |||||||
|
4 months p.a. | |||||||
| Pettah People’s Park Shopping Complex, Colombo 11 |
Investment method | – | 3,521 | – | 4,800 | – | 1,279 | |
|
Rs. 36,000 p.m. | |||||||
|
18.18 | |||||||
|
4 months p.a. | |||||||
| Wennappuwa No. 262, 264, Colombo Road, Wennappuwa |
Market comparable method | 37,500 | 20,815 | 42,000 | 28,000 | 4,500 | 7,185 | |
|
Rs. 1,400,000 p.p. | |||||||
|
Rs. 3,250 to Rs. 4,500 p.sq.ft. | |||||||
|
25% | |||||||
| Mr. W.S. Pemaratne | ||||||||
| Galewela No. 49/57, Matale Road, Galewela |
Market comparable method | 19,800 | 12,212 | 22,275 | 15,225 | 2,475 | 3,013 | |
|
Rs. 225,000 p.p. | |||||||
|
Rs. 2,250 to Rs. 3,500 p.sq.ft. | |||||||
|
15% | |||||||
| Kurunegala No. 4, Suratissa Mw., Kurunegala |
Market comparable method | |||||||
|
Rs. 3,500,000 to 4,150,000 p.p. | 140,000 | 78,636 | 199,325 | 34,675 | 59,325 | (43,961) | |
|
Rs. 3,000 to Rs. 4,250 p.sq.ft. | |||||||
|
10% | |||||||
| Narammala No. 55, Negombo Road, Narammala |
Market comparable method | 44,550 | 14,293 | 53,391 | 16,609 | 8,841 | 2,316 | |
|
Rs. 1,300,000 p.p. | |||||||
|
Rs. 3,500 p.sq.ft. | |||||||
|
5% | |||||||
| Total | 3,606,797 | 2,027,339 | 4,797,273 | 2,458,352 | 1,190,476 | 431,013 | ||
p.p. - per perch p.sq.ft. - per square foot p.m. - per month
Description of the above valuation techniques together with narrative descriptions on sensitivity of the fair value measurement to changes in significant unobservable inputs are tabulated below:
| Valuation Technique | Significant unobservable valuation inputs (ranges of each property are given in the table above) | Sensitivity of the fair value measurement to inputs |
| Market comparable method | Estimated fair value would increase (decrease) if; | |
| This method considers the selling price of a similar property within a reasonably recent period of time in determining the fair value of the property being revalued. This involves evaluation of recent active market prices of similar assets, making appropriate adjustments for differences in size, nature, location, condition of specific property. In this process, outlier transactions, indicative of particularly motivated buyers or sellers are too compensated for since the price may not adequately reflect the fair market value. | Price per perch for land | Price per perch increases (decreases) |
| Price per square foot for building | Price per square feet increases (decreases) | |
| Depreciation rate for building | Depreciation rate for building (decreases)/increases | |
| Investment method | Estimated fair value would increase (decrease) if; | |
| This method involves capitalisation of the expected rental income at an appropriate rate of years purchase currently characterised by the real estate market. |
Gross Annual Rentals | Gross Annual Rentals increases (decreases) |
| Years purchase (Present value of 1 unit per period) |
Years purchase increases (decreases) | |
| Void period | Void period (decreases)/increases |
36.6 Title Restriction on Property, Plant & Equipment
There were no restrictions existed on the title of the Property, Plant & Equipment of the Group/Bank as at the reporting date.
36.7 Property, Plant & Equipment Pledged as Security for Liabilities
There were no items of Property, Plant & Equipment pledged as securities for liabilities of the Group/Bank as at the reporting date.
36.8 Compensation from Third Parties for Items of Property, Plant & Equipment
The compensation received/receivable from third parties for items of Property, Plant & Equipment that were impaired, lost or given up at the Reporting Date of the Bank are as follows.
| As at December 31, | 2014 | 2013 |
| Rs. ’000 | Rs. ’000 | |
| Total claims lodged | 4,299 | 1,989 |
| Total claims received | (2,276) | (1,008) |
| Total claims rejected | (985) | (981) |
| Total claims receivable | 1,038 | – |
36.9 Fully Depreciated Property, Plant & Equipment
The cost of fully-depreciated Property, Plant & Equipment of the Bank which are still in use is as follows:
| As at December 31, | 2014 | 2013 |
| Rs. ’000 | Rs. ’000 | |
| Computer equipment | 1,965,926 | 1,794,881 |
| Office equipment, furniture and fixtures | 1,550,010 | 1,127,494 |
| Motor vehicles | 26,477 | 38,486 |
36.10 Temporarily Idle Property, Plant & Equipment
Following Property, Plant & Equipment of the Bank were temporarily idle (until the assets issued to business units).
| As at December 31, | 2014 | 2013 |
| Rs. ’000 | Rs. ’000 | |
| Computer equipment | 112,246 | 70,862 |
| Office equipment, furniture and fixtures | 69,729 | 80,490 |
36.11 Property, Plant & Equipment Retired from Active Use
Following Property, Plant & Equipment of the Bank were retired from active use.
| As at December 31, | 2014 | 2013 |
| Rs. ’000 | Rs. ’000 | |
| Computer equipment | 89,833 | 32,726 |
| Office equipment, furniture and fixtures | 58,413 | 16,300 |
| Motor vehicles | 214 | 214 |
36.12 Borrowing Costs
There were no capitalised borrowing costs related to the acquisition of Property, Plant & Equipment during the year 2014 (2013 - Nil).
37. Intangible Assets
| GROUP | BANK | |||
| 2014 | 2013 | 2014 | 2013 | |
| Rs. ’000 | Rs. ’000 | Rs. ’000 | Rs. ’000 | |
| Computer Software [Refer Note 37.1] | 397,644 | 423,233 | 389,096 | 422,668 |
| Software under development [Refer Note 37.2] | 58,541 | 54,495 | 50,032 | 44,925 |
| Goodwill arising on business combination [Refer Note 34.2.3] |
400,045 | – | – | – |
| Total | 856,230 | 477,728 | 439,128 | 467,593 |
37.1 Computer Software
| GROUP | BANK | |||
| As at December 31, | 2014 | 2013 | 2014 | 2013 |
| Rs. ’000 | Rs. ’000 | Rs. ’000 | Rs. ’000 | |
| Cost/Valuation | ||||
| Balance as at January 01, | 1,479,951 | 1,262,607 | 1,479,171 | 1,262,281 |
| Computer software acquired on business combination | 9,800 | – | – | – |
| Additions during the year | 139,387 | 216,162 | 139,310 | 215,708 |
| Disposals during the year | – | – | – | – |
| Exchange rate variance | (52) | 1,182 | (52) | 1,182 |
| Transfers/adjustments | – | – | – | – |
| Balance as at December 31, | 1,629,086 | 1,479,951 | 1,618,429 | 1,479,171 |
| Accumulated amortisation and impairment losses | ||||
| Balance as at January 01, | 1,056,718 | 906,586 | 1,056,503 | 906,427 |
| Accumulated amortisation assumed on business combination | 1,395 | – | – | – |
| Amortisation for the year [Refer Note 19] | 173,373 | 149,347 | 172,874 | 149,291 |
| Impairment loss | – | – | – | – |
| Disposals during the year | – | – | – | – |
| Exchange rate variance | (44) | 785 | (44) | 785 |
| Transfers/adjustments | – | – | – | – |
| Balance as at December 31, | 1,231,442 | 1,056,718 | 1,229,333 | 1,056,503 |
| Net book value as at December 31, | 397,644 | 423,233 | 389,096 | 422,668 |
| GROUP | BANK | |||
| As at December 31, | 2014 | 2013 | 2014 | 2013 |
| Rs. ’000 | Rs. ’000 | Rs. ’000 | Rs. ’000 | |
37.2 Software Under Development |
||||
| Cost/Valuation | ||||
| Balance as at January 01, | 54,495 | 150,140 | 44,925 | 141,184 |
| Additions during the year | 43,676 | 77,850 | 43,676 | 77,850 |
| Transfers/adjustments during the year | (38,569) | (174,109) | (38,569) | (174,109) |
| Exchange rate variance | (1,061) | 614 | – | – |
| Disposals during the year | – | – | – | – |
| Balance as at December 31, | 58,541 | 54,495 | 50,032 | 44,925 |
There were no restrictions existed on the title of the intangible assets of the Group/Bank as at the reporting date. Further, there were no items pledged as securities for liabilities. There were no capitalised borrowing costs related to the acquisition of intangible assets during the year 2014 (2013 - Nil).
The maturity analysis of Intangible Assets is given in Note 58.
38. Leasehold Property
| GROUP | BANK | |||
| As at December 31, | 2014 | 2013 | 2014 | 2013 |
| Rs. ’000 | Rs. ’000 | Rs. ’000 | Rs. ’000 | |
| Cost/Valuation, | ||||
| Balance as at January 01, | 128,700 | 128,700 | 84,840 | 84,840 |
| Additions during the year | – | – | – | – |
| Balance as at December 31, | 128,700 | 128,700 | 84,840 | 84,840 |
| Accumulated Amortisation | ||||
| Balance as at January 01, | 18,376 | 16,924 | 8,478 | 7,536 |
| Amortisation for the year [Refer Note 19] | 1,452 | 1,452 | 942 | 942 |
| Balance as at December 31, | 19,828 | 18,376 | 9,420 | 8,478 |
| Net book value as at December 31, | 108,872 | 110,324 | 75,420 | 76,362 |
The carrying amount of revalued assets that would have been included in the Financial Statements had the assets been carried at cost less depreciation/amortisation is as follows:
| GROUP | BANK | |||||
| As at December 31, 2014 | Cost | Accumulated Amortisation |
Net Book Value |
Cost | Accumulated Amortisation |
Net Book Value |
| Rs. ’000 | Rs. ’000 | Rs. ’000 | Rs. ’000 | Rs. ’000 | Rs. ’000 | |
| Class of Asset | ||||||
| Leasehold Land | 23,715 | 6,348 | 17,367 | 14,846 | 3,483 | 11,363 |
| Total | 23,715 | 6,348 | 17,367 | 14,846 | 3,483 | 11,363 |
| GROUP | BANK | |||||
| As at December 31, 2013 | Cost | Accumulated Amortisation |
Net Book Value |
Cost | Accumulated Amortisation |
Net Book Value |
| Rs. ’000 | Rs. ’000 | Rs. ’000 | Rs. ’000 | Rs. ’000 | Rs. ’000 | |
| Class of Asset | ||||||
| Leasehold Land | 23,715 | 6,109 | 17,606 | 14,846 | 3,333 | 11,513 |
| Total | 23,715 | 6,109 | 17,606 | 14,846 | 3,333 | 11,513 |
The maturity analysis of Leasehold Property is given in Note 58.
39. Other Assets
| GROUP | BANK | |||
| As at December 31, | 2014 | 2013 | 2014 | 2013 |
| Rs. ’000 | Rs. ’000 | Rs. ’000 | Rs. ’000 | |
| Receivables | 19,709 | 22,335 | 19,709 | 22,335 |
| Deposits and prepayments | 1,399,469 | 1,518,412 | 1,402,587 | 1,521,526 |
| Clearing account balance | 4,078,542 | 2,999,575 | 4,078,542 | 2,999,575 |
| Unamortised cost on staff loans (Day 1 difference) |
2,857,759 | 2,757,193 | 2,857,759 | 2,757,103 |
| Other accounts | 2,204,951 | 2,126,733 | 2,183,220 | 2,126,191 |
| Total | 10,560,430 | 9,424,248 | 10,541,817 | 9,426,730 |
The maturity analysis of Other Assets is given in Note 58.
40. Due to Banks
| GROUP | BANK | |||
| As at December 31, | 2014 | 2013 | 2014 | 2013 |
| Rs. ’000 | Rs. ’000 | Rs. ’000 | Rs. ’000 | |
| Borrowings | 23,326,066 | 7,915,406 | 22,918,017 | 7,915,406 |
| Local currency borrowings | 407,187 | – | – | – |
| Foreign currency borrowings | 22,918,879 | 7,915,406 | 22,918,017 | 7,915,406 |
| Securities sold under repurchase (repo) agreements | 2,342,959 | 6,278,813 | 2,342,959 | 6,278,813 |
| Total | 25,669,025 | 14,194,219 | 25,260,976 | 14,194,219 |
The maturity analysis of Due to Banks is given in Note 58.
41. Derivative Financial Liabilities
| GROUP | BANK | |||
| As at December 31, | 2014 | 2013 | 2014 | 2013 |
| Rs. ’000 | Rs. ’000 | Rs. ’000 | Rs. ’000 | |
| Foreign currency derivatives | ||||
| Currency swaps | 823,596 | – | 823,596 | – |
| Forward contracts | 368,886 | 1,406,553 | 368,886 | 1,406,553 |
| Spot contracts | 657 | 5,363 | 657 | 5,363 |
| Total | 1,193,139 | 1,411,916 | 1,193,139 | 1,411,916 |
The maturity analysis of Derivative Financial Liabilities is given in Note 58.
42. Due to Other Customers/Deposits from Customers
| GROUP | BANK | |||
| As at December 31, | 2014 | 2013 | 2014 | 2013 |
| Rs. ’000 | Rs. ’000 | Rs. ’000 | Rs. ’000 | |
| Local currency deposits | 401,872,201 | 342,766,248 | 401,967,097 | 342,820,225 |
| Current account balances | 34,311,477 | 27,775,664 | 34,317,565 | 27,775,704 |
| Savings deposits | 164,462,225 | 119,800,612 | 164,521,655 | 119,827,302 |
| Time deposits | 202,162,715 | 191,623,969 | 202,192,093 | 191,651,216 |
| Certificates of deposit | 935,784 | 3,566,003 | 935,784 | 3,566,003 |
| Foreign currency deposits | 127,394,387 | 108,332,698 | 127,394,387 | 108,332,698 |
| Current account balances | 10,809,389 | 9,111,749 | 10,809,389 | 9,111,749 |
| Savings deposits | 46,467,745 | 39,594,657 | 46,467,745 | 39,594,657 |
| Time deposits | 70,117,253 | 59,626,292 | 70,117,253 | 59,626,292 |
| Certificates of deposit | – | – | – | – |
| Total | 529,266,588 | 451,098,946 | 529,361,484 | 451,152,923 |
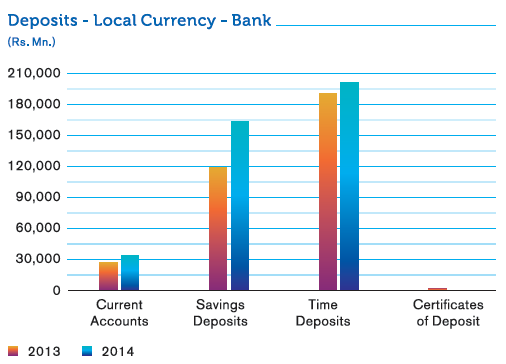
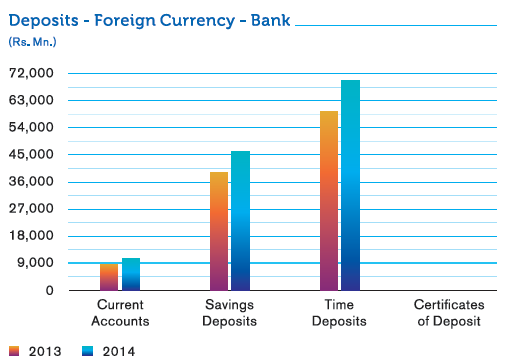
42.1 Analysis of due to Customers/Deposits from Customers
| GROUP | BANK | |||
| As at December 31, | 2014 | 2013 | 2014 | 2013 |
| Rs. ’000 | Rs. ’000 | Rs. ’000 | Rs. ’000 | |
(a) By product |
||||
| Current account balances | 45,120,866 | 36,887,413 | 45,126,954 | 36,887,453 |
| Savings deposits | 210,929,970 | 159,395,269 | 210,989,400 | 159,421,959 |
| Time deposits | 272,279,968 | 251,250,261 | 272,309,346 | 251,277,508 |
| Certificates of deposit | 935,784 | 3,566,003 | 935,784 | 3,566,003 |
| Sub total | 529,266,588 | 451,098,946 | 529,361,484 | 451,152,923 |
(b) By currency |
||||
| Sri Lankan Rupee | 401,872,201 | 342,766,248 | 401,967,097 | 342,820,225 |
| United States Dollar | 78,352,927 | 59,873,351 | 78,352,927 | 59,873,351 |
| Great Britain Pound | 7,567,161 | 7,437,142 | 7,567,161 | 7,437,142 |
| Euro | 25,425,565 | 27,698,162 | 25,425,565 | 27,698,162 |
| Australian Dollar | 7,935,496 | 5,474,369 | 7,935,496 | 5,474,369 |
| Bangladesh Taka | 6,800,927 | 6,556,111 | 6,800,927 | 6,556,111 |
| Other currencies | 1,312,311 | 1,293,563 | 1,312,311 | 1,293,563 |
| Sub total | 529,266,588 | 451,098,946 | 529,361,484 | 451,152,923 |
(c) By institution/customers |
||||
| Deposits from banks | 766,916 | 1,704,408 | 766,916 | 1,704,408 |
| Deposits from finance companies | 5,406,461 | 3,736,661 | 5,406,461 | 3,736,661 |
| Deposits from other customers | 523,093,211 | 445,657,877 | 523,188,107 | 445,711,854 |
| Sub total | 529,266,588 | 451,098,946 | 529,361,484 | 451,152,923 |
The maturity analysis of Deposits from Customers is given in Note 58.
The maturity analysis of Other Borrowings is given in Note 58.
44. Current Tax Liabilities
| GROUP | BANK | |||
| As at December 31, | 2014 | 2013 | 2014 | 2013 |
| Rs. ’000 | Rs. ’000 | Rs. ’000 | Rs. ’000 | |
| Balance as at January 01, | 1,780,867 | 2,821,975 | 1,758,574 | 2,801,541 |
| Tax payable assumed on business combination | 7,200 | – | – | – |
| Provision for the year | 4,484,017 | 4,068,507 | 4,424,113 | 4,030,734 |
| Reversal of (over)/under provision | 10,920 | (167,169) | 11,041 | (169,789) |
| Self-assessment payments | (3,036,746) | (3,998,722) | (2,988,916) | (3,962,673) |
| Notional tax credits | (1,080,686) | (905,407) | (1,079,038) | (903,649) |
| Withholding tax/other credits | (126,348) | (81,089) | (125,948) | (80,362) |
| Exchange rate variance | (1,836) | 42,772 | (1,836) | 42,772 |
| Balance as at December 31, | 2,037,388 | 1,780,867 | 1,997,990 | 1,758,574 |
The maturity analysis of Current Tax Liabilities is given in Note 58.
45. Deferred Tax Assets and Liabilities
45.1 Summary of Net Deferred Tax Liability
| GROUP | BANK | |||||||
| 2014 | 2013 | 2014 | 2013 | |||||
| Temporary Difference |
Tax Effect | Temporary Difference |
Tax Effect | Temporary Difference |
Tax Effect | Temporary Difference |
Tax Effect | |
| Rs. ’000 | Rs. ’000 | Rs. ’000 | Rs. ’000 | Rs. ’000 | Rs. ’000 | Rs. ’000 | Rs. ’000 | |
| Balance as at January 01, | 6,407,851 | 1,763,414 | 5,191,693 | 1,431,725 | 5,692,341 | 1,563,070 | 4,541,132 | 1,249,567 |
| Deferred tax liabilities assumed on business combination |
168,900 | 47,293 | – | – | – | – | – | – |
| Amount originating/(reversing) to Income Statement |
490,269 | 122,187 | 755,857 | 206,506 | 485,610 | 120,881 | 747,134 | 204,063 |
| Amount originating/(reversing) to Statement of Profit or Loss and Other Comprehensive Income |
3,368,207 | 943,098 | (27,425) | (7,679) | 3,177,150 | 889,602 | (28,704) | (8,037) |
| Tax effect on pre-acquisition reserves | – | – | 54,947 | 15,385 | – | – | – | – |
| Unwinding of the deferred tax effect on revaluation surplus on freehold buildings |
– | – | 432,779 | 121,178 | – | – | 432,779 | 121,178 |
| Exchange rate variance | – | 207 | – | (3,701) | – | 207 | – | (3,701) |
| Balance as at December 31, | 10,435,227 | 2,876,199 | 6,407,851 | 1,763,414 | 9,355,101 | 2,573,760 | 5,692,341 | 1,563,070 |
45.2 Reconciliation of Net Deferred Tax Liability
| GROUP | ||||||
| Statement of Financial Position |
Income Statement | Statement of Profit or Loss and Other Comprehensive Income |
||||
| 2014 | 2013 | 2014 | 2013 | 2014 | 2013 | |
| Rs. ’000 | Rs. ’000 | Rs. ’000 | Rs. ’000 | Rs. ’000 | Rs. ’000 | |
| Deferred Tax Liabilities on: | ||||||
| Accelerated depreciation for tax purposes - Own assets | 373,175 | 397,135 | 33,651 | (55,097) | – | – |
| Accelerated depreciation for tax purposes - Leased assets | 1,581,807 | 1,274,209 | (253,603) | (224,950) | – | – |
| Revaluation surplus on freehold buildings | 780,357 | 605,322 | 15,107 | 29,918 | (174,239) | – |
| Tax effect on actuarial gains on defined benefit plans | 3,584 | 2,062 | – | – | (1,522) | (2,062) |
| Unrealised gain/(loss) on Available-for-Sale (AFS) portfolio | 792,513 | – | – | – | (792,513) | – |
| Effective interest rate on deposits | 3,398 | – | (3,398) | – | – | – |
| Effect of exchange rate variance | 9 | 9 | 207 | (3,701) | – | – |
| 3,534,843 | 2,278,737 | (208,036) | (253,830) | (968,274) | (2,062) | |
| Deferred Tax Assets on: | ||||||
| Finance leases | 203 | 2,004 | (1,801) | (3,086) | – | – |
| Defined benefit plans | 281,040 | 245,563 | 35,477 | 41,660 | – | – |
| Tax effect on actuarial losses on defined benefit plans | 15,801 | 9,741 | – | – | 6,060 | 9,741 |
| Provision on credit card advances | – | – | – | (18,567) | – | – |
| Specific provision on lease receivable | 56,254 | 56,254 | – | (63,282) | – | – |
| Leave encashment | 160,990 | 153,608 | 7,382 | 42,446 | – | – |
| Tax effect on actuarial losses on leave encashment | 19,116 | – | – | – | 19,116 | – |
| Straight lining on lease rentals | 19,222 | 8,739 | 10,483 | 8,739 | – | – |
| De-recognition of commission income | 70,662 | 39,414 | 31,248 | 39,414 | – | – |
| Impairment provision | 35,356 | – | 4,679 | – | – | – |
| Carried forward tax loss on leasing business | – | – | (1,619) | – | – | – |
| 658,644 | 515,323 | 85,849 | 47,324 | 25,176 | 9,741 | |
| Deferred tax effect on Income Statement and Statement of Profit or Loss and Other Comprehensive Income for the year |
(122,187) | (206,506) | (943,098) | 7,679 | ||
| Net deferred tax liability as at December 31, | 2,876,199 | 1,763,414 | ||||
45.3 Reconciliation of Net Deferred Tax Liability
| BANK | ||||||
| Statement of Financial Position |
Income Statement | Statement of Profit or Loss and Other Comprehensive Income |
||||
| For the year ended/as at December 31, | 2014 | 2013 | 2014 | 2013 | 2014 | 2013 |
| Rs. ’000 | Rs. ’000 | Rs. ’000 | Rs. ’000 | Rs. ’000 | Rs. ’000 | |
| Deferred Tax Liabilities on: | ||||||
| Accelerated depreciation for tax purposes - Own assets | 330,867 | 366,494 | 35,627 | (54,362) | – | – |
| Accelerated depreciation for tax purposes - Leased assets | 1,525,515 | 1,274,208 | (251,307) | (224,949) | – | – |
| Revaluation surplus on freehold buildings | 533,651 | 427,927 | 14,960 | 29,918 | (120,684) | – |
| Tax effect on actuarial gains on defined benefit plans | 3,059 | 1,510 | – | – | (1,549) | (1,510) |
| Unrealised gain/(loss) on Available-for-sale (AFS) portfolio | 792,511 | – | – | – | (792,511) | – |
| Effective interest rate on deposits | 3,398 | – | (3,398) | – | – | – |
| Effect of exchange rate variance | 9 | 9 | 207 | (3,701) | – | – |
| 3,189,010 | 2,070,148 | (203,911) | (253,094) | (914,744) | (1,510) | |
| Deferred Tax Assets on: | ||||||
| Finance leases | – | – | – | – | – | – |
| Defined benefit plans | 273,433 | 239,516 | 33,917 | 40,282 | – | – |
| Tax effect on actuarial losses on defined benefit plans | 15,573 | 9,547 | – | – | 6,026 | 9,547 |
| Provision on credit card advances | – | – | – | (18,568) | – | – |
| Specific provision on lease receivable | 56,254 | 56,254 | – | (63,282) | – | – |
| Leave encashment | 160,990 | 153,608 | 7,382 | 42,446 | – | – |
| Tax effect on actuarial losses on leave encashment | 19,116 | – | – | – | 19,116 | – |
| Straight lining of lease rentals | 19,222 | 8,739 | 10,483 | 8,739 | – | – |
| De-recognition of commission income | 70,662 | 39,414 | 31,248 | 39,414 | – | – |
| 615,250 | 507,078 | 83,030 | 49,031 | 25,142 | 9,547 | |
| Deferred tax effect on Income Statement and Statement of Profit or Loss and Other Comprehensive Income for the year |
(120,881) | (204,063) | (889,602) | 8,037 | ||
| Net deferred tax liability as at December 31 | 2,573,760 | 1,563,070 | ||||
The maturity analysis of Deferred Tax Liabilities is given in Note 58.
46. Other Provisions
| GROUP | BANK | |||
| As at December 31, | 2014 | 2013 | 2014 | 2013 |
| Rs. ’000 | Rs. ’000 | Rs. ’000 | Rs. ’000 | |
| Provision for claims payable | 1,874 | 2,409 | 1,874 | 2,409 |
| Total | 1,874 | 2,409 | 1,874 | 2,409 |
The maturity analysis of Other Liabilities is given in Note 58.
47.1 Provision for Gratuity Payable
An actuarial valuation of the retirement gratuity payable was carried out as at December 31, 2014 by Mr. M. Poopalanathan, AIA, of Messrs Actuarial & Management Consultants (Pvt) Ltd., a firm of professional actuaries. The valuation method used by the actuaries to value the liability is the ‘Projected Unit Credit Method (PUC)’, the method recommended by the Sri Lanka Accounting Standard, LKAS 19 on ‘Employee Benefits’.
47.1 (a) Actuarial Assumptions
| Type of Assumption | Criteria | Description |
| Demographic | Mortality - In service | A 67/70 Mortality table issued by the Institute of Actuaries, London |
| Staff Turnover | The staff turnover rate at an age represents the probability of an employee leaving within one year of that age due to reasons other than death, ill health and normal retirement. The same withdrawal rates which were used in the last valuation (as at December 31, 2013) to determine the liabilities of the active employees in the gratuity, were used in the actuarial valuation carried out as at December 31, 2014. | |
| Normal retirement age | The employees who are aged over the specified retirement age have been assumed to retire on their respective next birthdays. | |
| Financial | Rate of discount | Sri Lankan operation In the absence of a deep market in long term bonds in Sri Lanka, a long term interest rate of 9.50% p.a. (2013 - 10% p.a.) has been used to discount future liabilities considering anticipated long term rate of inflation. |
| Bangladesh operation In the absence of long term high quality corporate bonds or Government bonds with the term that matches liabilities a long term interest rate of 10% p.a. (2013 - 10% p.a.) has been used to discount considering anticipated long term rate of inflation. |
||
| Salary increases | A salary increment of 9% p.a. (2013 - 9% p.a.) has been used in respect of the active employees. |
47.1 (b) Movement in the Provision for Gratuity Payable
| GROUP | BANK | |||
| 2014 | 2013 | 2014 | 2013 | |
| Rs. ’000 | Rs. ’000 | Rs. ’000 | Rs. ’000 | |
| Balance as at January 01, | 624,642 | 494,507 | 604,324 | 478,506 |
| Gratuity payable assumed on business combination | 1,977 | – | – | – |
| Expense recognised in the Income Statement [Refer Note 47.1 (c)] | 145,284 | 147,378 | 138,533 | 141,700 |
| Exchange rate variance | (381) | 7,294 | (381) | 7,294 |
| Amount paid during the year | (17,245) | (19,528) | (16,423) | (17,784) |
| Expense recognised in other comprehensive income | (5,308) | (5,009) | (5,533) | (5,392) |
| Balance as at December 31, | 748,969 | 624,642 | 720,520 | 604,324 |
47.1 (c) Expense Recognised in the Income Statement - Gratuity
| GROUP | BANK | |||
| For the year ended December 31, | 2014 | 2013 | 2014 | 2013 |
| Rs. ’000 | Rs. ’000 | Rs. ’000 | Rs. ’000 | |
| Interest cost | 62,456 | 56,118 | 60,340 | 54,470 |
| Current service cost | 82,828 | 91,260 | 78,193 | 87,230 |
| Total | 145,284 | 147,378 | 138,533 | 141,700 |
47.1 (d) Sensitivity Analysis of Actuarial Valuation
The following table illustrates the impact of the possible changes in the discount rate and salary escalation rates on the gratuity valuation of the Group and the Bank as at December 31, 2014:
| Group | Bank | |
| Variable | Sensitivity Effect on Statement of
Financial Position (Benefit Obligation) Rs. ’000 |
Sensitivity Effect on Statement of
Financial Position (Benefit Obligation) Rs. ’000 |
| 1% increase in discount rate | (81,183) | (78,974) |
| 1% decrease in discount rate | 98,361 | 95,859 |
| 1% increase in salary escalation rate | 100,896 | 98,408 |
| 1% decrease in salary escalation rate | (84,573) | (82,362) |
47.2 Provision for Un-funded Pension Scheme
An actuarial valuation of the un-funded pension liability was carried out as at December 31, 2014 by Mr. M. Poopalanathan, AIA, of Messrs Actuarial & Management Consultants (Pvt) Ltd., a firm of professional actuaries. The valuation method used by the actuary to value the liability is the ‘Projected Unit Credit Method (PUC)’, the method recommended by the Sri Lanka Accounting Standard, LKAS 19 on ‘Employee Benefits’.
47.2 (a) Actuarial Assumptions
| Type of Assumption | Criteria | Description |
| Demographic | Mortality - In service | A 67/70 Mortality table issued by the Institute of Actuaries, London. |
| After retirement | A (90) Annuities table (Males and Females) issued by the Institute of Actuaries, London. | |
| Staff turnover | The withdrawal rate at an age represents the probability of an active employee leaving within one year of that age due to reasons other than death, ill health and normal retirement. The same withdrawal rates which were used in the last valuation (as at December 31, 2013) to determine the liabilities of the active employees in the funded scheme, were used in the actuarial valuation carried out as at December 31, 2014. | |
| Disability | Assumptions similar to those used in other comparable schemes for disability were used as the data required to do a ‘scheme specific’ study was not available. | |
| Normal retirement age | 55 or 60 years as indicated in the data file of active employees. | |
| Financial | Rate of discount | In the absence of a deep market in long term bonds in Sri Lanka, a long term interest rate of 9.50% p.a. (2013 - 10% p.a.) has been used to discount future liabilities considering anticipated long term rate of inflation. |
| Salary increases | A salary increment of 9% p.a. (2013 - 9% p.a.) has been used in respect of the active employees. | |
| Post retirement pension increase rate | There is no agreed rate of increase even though the pension payments are subject to periodic increases, and increases are granted solely at the discretion of the Bank. Therefore, no specific rate was assumed for this valuation. |
47.2 (b) Movement in the Provision for Un-funded Pension Scheme
| GROUP | BANK | |||
| 2014 | 2013 | 2014 | 2013 | |
| Rs. ’000 | Rs. ’000 | Rs. ’000 | Rs. ’000 | |
| Balance as at January 01, | 191,541 | 167,394 | 191,541 | 167,394 |
| Expense recognised in the income statement [Refer Note 47.2 (c)] | 19,154 | 18,413 | 19,154 | 18,413 |
| Amount paid during the year | (28,756) | (28,363) | (28,756) | (28,363) |
| Expense recognised in other comprehensive income | 21,519 | 34,097 | 21,519 | 34,097 |
| Balance as at December 31, | 203,458 | 191,541 | 203,458 | 191,541 |
47.2 (c) Expense Recognised in the Income Statement – Un-funded Pension
| GROUP | BANK | |||
| For the year ended December 31, | 2014 | 2013 | 2014 | 2013 |
| Rs. ’000 | Rs. ’000 | Rs. ’000 | Rs. ’000 | |
| Interest cost | 19,154 | 18,413 | 19,154 | 18,413 |
| Current service cost | – | – | – | – |
| Total | 19,154 | 18,413 | 19,154 | 18,413 |
47.2 (d) Sensitivity Analysis on Actuarial Valuation – Un-funded Pension Scheme
The following table illustrates the impact of the possible change in the discount rate and salary escalation rate in the un-funded pension scheme valuation of the Bank as at December 31, 2014.
| Group | Bank | |
| Variable | Sensitivity Effect on Statement of
Financial Position (Benefit Obligation) Rs. ’000 |
Sensitivity Effect on Statement of
Financial Position (Benefit Obligation) Rs. ’000 |
| 1% increase in discount rate | (9,014) | (9,014) |
| 1% decrease in discount rate | 9,949 | 9,949 |
| 1% increase in salary escalation rate | – | – |
| 1% decrease in salary escalation rate | – | – |
47.3 Provision for Leave Encashment
An actuarial valuation of the leave encashment liability was carried out as at December 31, 2014 by Mr. M. Poopalanathan, AIA, of Messrs Actuarial & Management Consultants (Pvt) Ltd., a firm of professional actuaries. The valuation method used by the actuaries to value the liability is the ‘Projected Unit Credit Method (PUC)’, the method recommended by the Sri Lanka Accounting Standard, LKAS 19 on ‘Employee Benefits’.
47.3 (a) Actuarial Assumptions
| Type of Assumption | Criteria | Description |
| Demographic | Mortality - In service | A 1967/70 Mortality table issued by the Institute of Actuaries, London |
| Staff turnover | The probability of a member withdrawing from the scheme within a year of the ages between 20 to 55 years. | |
| Disability | The probability of a member becoming disabled within a year of the ages between 20 to 55 years. | |
| Financial | Rate of discount | In the absence of a deep market in long term bonds in Sri Lanka, a long term interest rate of 9.5% p.a. (2013 - 10% p.a.) has been used to discount future liabilities considering anticipated long term rate of inflation. |
| Salary increases | A salary increment of 9% p.a. (2013 - 9% p.a.) has been used in respect of the active employees. |
47.3 (b) Movement in the Provision for Leave Encashment
| GROUP | BANK | |||
| 2014 | 2013 | 2014 | 2013 | |
| Rs. ’000 | Rs. ’000 | Rs. ’000 | Rs. ’000 | |
| Balance as at January 01, | 548,601 | 397,009 | 548,601 | 397,009 |
| Expense recognised in the income statement [Refer Note 47.3 (c)] | 54,860 | 151,592 | 54,860 | 151,592 |
| Amount paid during the year | (28,496) | – | (28,496) | – |
| Expense recognised in other comprehensive income | 68,273 | – | 68,273 | – |
| Balance as at December 31, | 643,238 | 548,601 | 643,238 | 548,601 |
47.3 (c) Expense Recognised in the Income Statement – Leave Encashment
| GROUP | BANK | |||
| For the year ended December 31, | 2014 | 2013 | 2014 | 2013 |
| Rs. ’000 | Rs. ’000 | Rs. ’000 | Rs. ’000 | |
| Interest cost | 54,860 | 151,592 | 54,860 | 151,592 |
| Current service cost | – | – | – | – |
| Total | 54,860 | 151,592 | 54,860 | 151,592 |
47.3 (d) Sensitivity Analysis on Actuarial Valuation – Leave Encashment
The following table illustrates the impact of the possible change in the discount rates and salary escalation rates on account of leave encashment liability of the Bank as at December 31, 2014:
| GROUP | BANK | |
| Variable | Sensitivity effect on Statement of
Financial Position (Benefit Obligation) Rs. ’000 |
Sensitivity effect on Statement of
Financial Position (Benefit Obligation) Rs. ’000 |
| 1% increase in discount rate | (53,487) | (53,487) |
| 1% decrease in discount rate | 63,352 | 63,352 |
| 1% increase in salary escalation rate | 66,111 | 66,111 |
| 1% decrease in salary escalation rate | (56,724) | (56,724) |
47.4 Employee Retirement Benefit
Pension Fund - Defined Benefit Plan
An actuarial valuation of the Retirement Pension Fund was carried out as at December 31, 2014 by Mr. M. Poopalanathan, AIA, of Messrs Actuarial & Management Consultants (Pvt) Ltd., a firm of professional actuaries. The valuation method used by the actuaries to value the fund is the ‘Projected Unit Credit Method (PUC)’, the method recommended by the Sri Lanka Accounting Standard - LKAS 19 on ‘Employee Benefits’.
The assets of the fund, which are independently administered by the Trustees as per the provisions of the Trust Deed are held separately from those of the Bank.
47.4 (a) Actuarial Assumptions – Demographic
| Type of Assumption | Criteria | Description |
| Demographic | Mortality - in service | A 67/70 Mortality table issued by the Institute of Actuaries, London |
| After retirement | A (90) Annuities table (Males & Females) issued by the Institute of Actuaries, London | |
| Staff Turnover | The withdrawal rate at an age represents the probability of an active employee leaving within one year of that age due to reasons other than death, ill health and normal retirement. The same withdrawal rates which were used in the last valuation (as at December 31,2013) to determine the liability on account of the active employees in the funded scheme, were used in the actuarial valuation carried out as at December 31, 2014. | |
| Disability | Assumptions similar to those used in other comparable schemes for disability were used as the data required to do a "scheme specific" study was not available. | |
| Normal retirement age | 55 or 60 years as indicated in the data file of active employees. | |
| Financial | Rate of discount | In the absence of a deep market in long term bonds in Sri Lanka, a long term interest rate of 9.50% p.a. (2013 - 10% p.a.) has been used to discount future liabilities considering anticipated long term rate of inflation. |
| Salary increases | A salary increment of 9% p.a. (2013 - 9% p.a.) has been used in respect of the active employees. | |
| Post retirement pension increase rate | There is no agreed rate of increase even though the pension payments are subject to periodic increases, and increases are granted solely at the discretion of the Bank. Therefore, no specific rate was assumed for this valuation. |
47.4 (b) Movement in the Present Value of Defined Benefit Obligation – Bank
| 2014 Rs.'000 |
2013 Rs.'000 |
|
| Balance as at January 01, | 124,678 | 112,014 |
| Interest cost | 12,468 | 12,321 |
| Current service cost | 2,575 | 2,102 |
| Benefits paid during the year | (10,003) | (8,119) |
| Actuarial loss | 10,593 | 6,360 |
| Balance as at December 31, | 140,311 | 124,678 |
47.4. (c) Movement in the Fair Value of Plan Assets
| 2014 Rs.'000 |
2013 Rs.'000 |
|
| Fair value as at January 01, | 117,900 | 94,899 |
| Expected return on plan assets | 11,790 | 10,439 |
| Contribution paid into plan | 1,296 | 1,411 |
| Benefits paid by the plan | (10,003) | (8,119) |
| Actuarial gain on plan assets | 4,725 | 19,270 |
| Fair value as at December 31, | 125,708 | 117,900 |
47.4 (e) Plan Assets Consist of the following
| 2014 Rs.'000 |
2013 Rs.'000 |
|
| Government treasury bills | 1,171 | 42,512 |
| Deposits held with the Bank | 124,537 | 75,388 |
| Total | 125,708 | 117,900 |
48. Due to Subsidiaries
| GROUP | BANK | |||
| As at December 31, | 2014 | 2013 | 2014 | 2013 |
| Rs. ’000 | Rs. ’000 | Rs. ’000 | Rs. ’000 | |
| Local subsidiaries | ||||
| Commercial Development Company PLC | – | – | 12,079 | 8,934 |
| ONEzero Company Ltd. | – | – | 7,210 | 6,752 |
| Indra Finance Ltd. | – | – | – | – |
| Sub total | – | – | 19,289 | 15,686 |
| Foreign subsidiaries | ||||
| Commex Sri Lanka S.R.L. - Italy | – | – | – | – |
| Sub total | – | – | – | – |
| Total | – | – | 19,289 | 15,686 |
The maturity analysis of Due to Subsidiaries is given in Note 58.
49. Subordinated Liabilities
| GROUP | BANK | |||
| As at December 31, | 2014 | 2013 | 2014 | 2013 |
| Rs. ’000 | Rs. ’000 | Rs. ’000 | Rs. ’000 | |
| Balance as at January 01, | 10,797,660 | 973,210 | 10,797,660 | 973,210 |
| Subordinated liabilities assumed on business combination | 215,000 | – | – | – |
| Amount borrowed during the year | – | 9,468,750 | – | 9,468,750 |
| Repayments/redemptions during the year | – | (550) | – | (550) |
| Sub total | 11,012,660 | 10,441,410 | 10,797,660 | 10,441,410 |
| Exchange rate variance | 86,250 | 356,250 | 86,250 | 356,250 |
| Balance as at December 31, (before adjusting for amortised interest and transaction cost) [Refer Note 49.1] | 11,098,910 | 10,797,660 | 10,883,910 | 10,797,660 |
| Unamortised transaction cost | (100,225) | (112,435) | (100,225) | (112,435) |
| Net effect of amortised interest payable | 263,888 | 259,187 | 261,090 | 259,187 |
| Adjusted balance as at December 31, | 11,262,573 | 10,944,412 | 11,044,775 | 10,944,412 |
Outstanding subordinated liabilities of the Bank as at December 31, 2014 consisted of 972,660 (2013 - 972,660) unsecured subordinated redeemable debentures of Rs. 1,000/- each and a subordinated loan of US$ 75.0 Mn. (2013 - US$ 75.0 Mn.) from International Finance Corporation (IFC).
49.1 Categories of Subordinated Liabilities
| Categories | Colombo Stock Exchange Listing |
Interest Payable Frequency |
Allotment Date |
Maturity Date |
Effective Annual Yield | GROUP | BANK | |||
| 2014 | 2013 | 2014 | 2013 | 2014 | 2013 | |||||
| Rs. ’000 | Rs. ’000 | Rs. ’000 | Rs. ’000 | |||||||
| Fixed Rate Debentures | ||||||||||
| 2006/2016 - 13.25% p.a. | Not listed | Annually | 16.05.2006 | 16.05.2016 | 13.25% | 13.25% | 505,000 | 505,000 | 505,000 | 505,000 |
| 2006/2016 - 14.00% p.a. | Listed | Annually | 18.12.2006 | 18.12.2016 | 14.00% | 14.00% | 467,260 | 467,260 | 467,260 | 467,260 |
| Floating Rate Debentures | ||||||||||
| 2006/2016 - 12 months TB rate (Gross) + 1% p.a.(*) |
Listed | Annually | 18.12.2006 | 18.12.2016 | 10.21% | 13.99% | 400 | 400 | 400 | 400 |
| Floating Rate Subordinated Loans | ||||||||||
| IFC Borrowings - LIBOR + 5.75% |
Biannually | 13.03.2013 | 14.03.2023 | LIBOR + 6.16% | LIBOR + 6.21% | 9,911,250 | 9,825,000 | 9,911,250 | 9,825,000 | |
| Subsidiaries | ||||||||||
| Fixed Rate Debentures | ||||||||||
| 2011/2016 - 14.15% p.a. | Not listed | Monthly | 25.08.2011 | 25.08.2016 | 15.10% | – | 10,000 | – | – | – |
| 2011/2016 - 14.15% p.a. | Not listed | Monthly | 25.08.2011 | 25.08.2016 | 15.10% | – | 5,000 | – | – | – |
| 2012/2015 - 18.65% p.a. | Not listed | Quarterly | 01.12.2012 | 01.12.2015 | 20.00% | – | 200,000 | – | – | – |
| Total | 11,098,910 | 10,797,660 | 10,883,910 | 10,797,660 | ||||||
(*) The 12 Months TB rate (Gross) - Twelve months Treasury Bill rate mentioned above is before deducting 10% Withholding Tax as published by the Central Bank of Sri Lanka immediately prior to the commencement of each interest period.
49.2 Subordinated Liabilities by Maturity
| GROUP | BANK | |||
| As at December 31, | 2014 | 2013 | 2014 | 2013 |
| Rs. ’000 | Rs. ’000 | Rs. ’000 | Rs. ’000 | |
| Payable within one year | 200,000 | – | – | – |
| Payable after one year | 10,898,910 | 10,797,660 | 10,883,910 | 10,797,660 |
| Total | 11,098,910 | 10,797,660 | 10,883,910 | 10,797,660 |
In the event of the winding-up of the issuer, the above liabilities would be subordinated to the claims of depositors and all other creditors of the issuer. The Bank has not had any defaults of principal, interest or other breaches with respect to its subordinated liabilities during the year ended December 31, 2014.
The maturity analysis of Subordinated Liabilities is given in Note 58.
50. Stated Capital
| GROUP | BANK | |||
| 2014 | 2013 | 2014 | 2013 | |
| Rs. ’000 | Rs. ’000 | Rs. ’000 | Rs. ’000 | |
| Balance as at January 01, | 19,586,813 | 18,008,796 | 19,586,813 | 18,008,796 |
| Issue of ordinary voting shares under the Employee Share Option Plan | 340,763 | 76,074 | 340,763 | 76,074 |
| Issue of ordinary shares as part of the final dividend satisfied in the form of issue and allotment of new shares |
1,529,925 | 1,501,943 | 1,529,925 | 1,501,943 |
| Ordinary voting shares | 1,431,747 | 1,405,690 | 1,431,747 | 1,405,690 |
| Ordinary non-voting shares | 98,178 | 96,253 | 98,178 | 96,253 |
| Balance as at December 31, | 21,457,501 | 19,586,813 | 21,457,501 | 19,586,813 |
50.1 Movement in Number of Shares
| No. of Ordinary Voting Shares | No. of Ordinary Non-Voting Shares | |||
| 2014 | 2013 | 2014 | 2013 | |
| Balance as at January 01, | 794,535,819 | 780,014,232 | 54,543,222 | 53,473,748 |
| Issue of ordinary voting shares under the Employee Share Option Plan | 3,237,566 | 1,445,398 | – | – |
| Issue of ordinary shares as part of the final dividend satisfied in the form of issue and allotment of new shares |
12,504,344 | 13,076,189 | 1,036,724 | 1,069,474 |
| Balance as at December 31, | 810,277,729 | 794,535,819 | 55,579,946 | 54,543,222 |
The ordinary shares of Commercial Bank of Ceylon PLC are quoted in the Colombo Stock Exchange. The Non-Voting Ordinary Shares of the Bank, rank pari passu in respect of all rights with the Ordinary Voting Shares of the Bank except voting rights on resolutions passed at general meetings.
The holders of ordinary shares are entitled to receive dividends declared from time to time and are entitled to one vote per share at General Meetings of the Bank.
The Bank has offered an Employee Share Option Plan. Please see Note 50.2 below for details.
50.2 Employee Share Option Plan - 2008
The Bank obtained the approval of the shareholders at an Extraordinary General Meeting held on April 16, 2008, to introduce an Employee Share Option Plan for the benefit of all the Executive Officers in Grade III and above by creating up to 3% of the ordinary voting shares at the rate of 1% shares each year over a period of three to five years, upon the Bank achieving specified performance targets.
Option price is determined on the basis of the weighted average market price of Bank’s voting shares, during the period of ten market days immediately prior to each option offer date.
Number of options offered under each tranche is based on the overall performance of the Bank and the individual performance of the eligible employees in the preceding year. In the event of a rights issue of shares, capitalisation of reserves, stock splits or stock dividends by the Bank during the vesting period, the number of options offered and the price are suitably adjusted as per the applicable rules of ESOP - 2008 which have been drafted in line with the accepted market practices.
1/3 of the options offered under each tranche is vested to eligible employees after one year from the date of offer, second 1/3 of the options after two years from the date of offer and final 1/3 after three years from the date of offer as detailed below:
| Tranche I | Total | |||
| Date granted | April 30, 2008 | April 30, 2008 | April 30, 2008 | |
| Price (Rs.) - (*) | 46.91 | 46.91 | 46.91 | |
| 1/3 of Options | 1/3 of Options | 1/3 of Options | ||
| Exercisable between | April 30, 2009 to April 29, 2013 | April 30, 2010 to April 29, 2014 | April 30, 2011 to April 29, 2015 | |
| Original number of options | 777,308 | 777,308 | 777,308 | 2,331,924 |
| Additions consequent to share splits and rights issues | 692,095 | 789,320 | 1,056,943 | 2,538,358 |
| Number of options cancelled before vesting | (52,943) | (52,943) | (52,943) | (158,829) |
| Number of options vested | 1,416,460 | 1,513,685 | 1,781,308 | 4,711,453 |
| Number of options exercised up to December 31, 2014 | (1,416,460) | (1,513,685) | (1,560,352) | (4,490,497) |
| Number of options to be exercised as at December 31, 2014 | – | – | 220,956 | 220,956 |
(*) Adjusted on account of the dividends declared in the form of issue and allotment of new shares, rights issue of shares and sub-division of shares.
| Tranche II | Total | |||
| Date granted | April 30, 2011 | April 30, 2011 | April 30, 2011 | |
| Price (Rs.) | 132.23 | 132.23 | 132.23 | |
| 1/3 of Options | 1/3 of Options | 1/3 of Options | ||
| Exercisable between | April 30, 2012 to April 29, 2016 | April 30, 2013 to April 29, 2017 | April 30, 2014 to April 29, 2018 | |
| Original number of options | 1,213,384 | 1,213,384 | 1,213,384 | 3,640,152 |
| Additions consequent to share splits and rights issues | 1,213,384 | 1,213,384 | 1,213,384 | 3,640,152 |
| Number of options cancelled before vesting | (45,896) | (41,307) | (95,236) | (182,439) |
| Number of options vested | 2,380,872 | 2,385,461 | 2,331,532 | 7,097,865 |
| Number of options exercised up to December 31, 2014 | (420,445) | (253,578) | (126,038) | (800,061) |
| Number of options to be exercised as at December 31, 2014 | 1,960,427 | 2,131,883 | 2,205,494 | 6,297,804 |
| Tranche III | Total | |||
| Date granted | April 30, 2012 | April 30, 2012 | April 30, 2012 | |
| Price (Rs.) | 104.63 | 104.63 | 104.63 | |
| 1/3 of Options | 1/3 of Options | 1/3 of Options | ||
| Exercisable between | April 30, 2013 to April 29, 2017 | April 30, 2014 to April 29, 2018 | April 30, 2015 to April 29, 2019 | |
| Original number of options | 2,596,622 | 2,596,622 | 2,596,600 | 7,789,844 |
| Number of options cancelled before vesting | – | (49,704) | (79,961) | (129,665) |
| Number of options vested | 2,596,622 | 2,546,918 | 2,516,639 | 7,660,179 |
| Number of options exercised up to December 31, 2014 | (1,225,627) | (718,575) | (266,905) | (2,211,107) |
| Number of options to be exercised as at December 31, 2014 | 1,370,995 | 1,828,343 | 2,249,734 | 5,449,072 |
51. Statutory Reserves
| GROUP | BANK | |||
| As at December 31, | 2014 | 2013 | 2014 | 2013 |
| Rs. ’000 | Rs. ’000 | Rs. ’000 | Rs. ’000 | |
| Statutory reserve fund [Refer Note 51.1] | 4,327,103 | 3,768,094 | 4,327,103 | 3,768,094 |
| Primary dealer special risk reserve [Refer Note 51.2] | – | 266,520 | – | 266,520 |
| Sub total | 4,327,103 | 4,034,614 | 4,327,103 | 4,034,614 |
51.1 Statutory Reserve Fund
| GROUP | BANK | |||
| 2014 | 2013 | 2014 | 2013 | |
| Rs. ’000 | Rs. ’000 | Rs. ’000 | Rs. ’000 | |
| Balance as at January 01, | 3,768,094 | 3,245,818 | 3,768,094 | 3,245,818 |
| Transfers during the year | 559,009 | 522,276 | 559,009 | 522,276 |
| Balance as at December 31, | 4,327,103 | 3,768,094 | 4,327,103 | 3,768,094 |
The statutory reserve fund is maintained as per the requirements under section 20 (1) of the Banking Act No. 30 of 1988. Accordingly, the fund is built up by allocating a sum equivalent to not less than 5% of the profit after tax, but before declaring any dividend or any profits that are transferred elsewhere until the balance in the reserve fund is equal to 50% of the Bank's stated capital and thereafter a further sum equivalent to 2% of such profit until the amount in the reserve fund is equal to the stated capital of the Bank.
The balance in the Statutory Reserve Fund will be used only for the purposes specified in the Section 20 (2) of the Banking Act No. 30 of 1988.
51.2 Primary Dealer Special Risk Reserve
| GROUP | BANK | |||
| 2014 | 2013 | 2014 | 2013 | |
| Rs. ’000 | Rs. ’000 | Rs. ’000 | Rs. ’000 | |
| Balance as at January 01, | 266,520 | 187,577 | 266,520 | 187,577 |
| Transfers during the year | – | 78,943 | – | 78,943 |
| Transferred to general reserve [Refer Note 53.2] | (266,520) | – | (266,520) | – |
| Balance as at December 31, | – | 266,520 | – | 266,520 |
As per the Direction issued by the Public Debt - Department of the Central Bank of Sri Lanka on April 18, 2005, with effect from July 01, 2005 Primary Dealers who maintain a capital above Rs. 300 Mn. were required to transfer 25% of post-tax profits of the Primary Dealer Unit to a special risk reserve annually. The Bank duly complied with the above requirement up to December 31, 2013.
During 2014, the Bank received a confirmation from the Public Debt - Department of the Central Bank of Sri Lanka on the cessation of maintaining a Special Risk Reserve as the Bank is functioning as a primary dealer. Hence, the Bank transferred the balances that were built up in the above reserve to the General Reserve.
52. Retained Earnings
| GROUP | BANK | ||||
| 2014 | 2013 | 2014 | 2013 | ||
| Rs. ’000 | Rs. ’000 | Rs. ’000 | Rs. ’000 | ||
| Balance as at January 01, | 4,359,632 | 4,172,814 | 4,233,364 | 4,178,080 | |
| Total Comprehensive Income | 11,184,470 | 10,541,957 | 11,119,514 | 10,424,843 | |
| Profit for the year | 11,238,892 | 10,563,378 | 11,180,181 | 10,445,511 | |
| Other comprehensive income, net of tax | (54,422) | (21,421) | (60,667) | (20,668) | |
| Dividends paid | (5,547,136) | (5,444,752) | (5,547,136) | (5,444,752) | |
| Deferred tax effect on pre-acquisition reserves | – | (14,547) | – | – | |
| Re-classification of retained earnings to/from available for sale reserve | (31,099) | 28,967 | – | – | |
| Transfers to other reserves | (5,547,455) | (4,924,807) | (5,547,455) | (4,924,807) | |
| Balance as at December 31, | 4,418,412 | 4,359,632 | 4,258,287 | 4,233,364 | |
53. Other Reserves
| GROUP | BANK | |||||
| Balance as at January 01, |
Movement/ Transfers |
Balance as at December 31, |
Balance as at January 01, |
Movement/ Transfers |
Balance as at December 31, |
|
| Rs. ’000 | Rs. ’000 | Rs. ’000 | Rs. ’000 | Rs. ’000 | Rs. ’000 | |
53 (a) Current Year – 2014 |
||||||
| Revaluation reserve [Refer Note 53.1] | 4,615,947 | 1,631,013 | 6,246,960 | 4,222,054 | 1,500,805 | 5,722,859 |
| General reserve [Refer Note 53.2] | 22,380,819 | 10,093,659 | 32,474,478 | 22,380,819 | 10,093,659 | 32,474,478 |
| Available-for-sale reserve [Refer Note 53.3] | 2,023,468 | 712,101 | 2,735,569 | 2,054,567 | 681,011 | 2,735,578 |
| Foreign currency translation reserve [Refer Note 53.4] |
(393,758) | (60,430) | (454,188) | (406,925) | (57,151) | (464,076) |
| Investment fund reserve [Refer Note 53.5] | 4,838,693 | (4,838,693) | – | 4,838,693 | (4,838,693) | – |
| Total | 33,465,169 | 7,537,650 | 41,002,819 | 33,089,208 | 7,379,631 | 40,468,839 |
53 (b) Previous Year – 2013
| GROUP | BANK | |||||
| Balance as at January 01, |
Movement/ Transfers |
Balance as at December 31, |
Balance as at January 01, |
Movement/ Transfers |
Balance as at December 31, |
|
| Rs. ’000 | Rs. ’000 | Rs. ’000 | Rs. ’000 | Rs. ’000 | Rs. ’000 | |
| Revaluation reserve [Refer Note 53.1] | 4,737,125 | (121,178) | 4,615,947 | 4,343,232 | (121,178) | 4,222,054 |
| General reserve [Refer Note 53.2] | 20,048,989 | 2,331,830 | 22,380,819 | 20,048,989 | 2,331,830 | 22,380,819 |
| Available-for-sale reserve [Refer Note 53.3] | 475,467 | 1,548,001 | 2,023,468 | 475,467 | 1,579,100 | 2,054,567 |
| Foreign currency translation reserve [Refer Note 53.4] |
(755,101) | 361,343 | (393,758) | (757,894) | 350,969 | (406,925) |
| Investment fund reserve [Refer Note 53.5] | 2,846,935 | 1,991,758 | 4,838,693 | 2,846,935 | 1,991,758 | 4,838,693 |
| Total | 27,353,415 | 6,111,754 | 33,465,169 | 26,956,729 | 6,132,479 | 33,089,208 |
53.1 Revaluation Reserve
| GROUP | BANK | |||
| 2014 | 2013 | 2014 | 2013 | |
| Rs. ’000 | Rs. ’000 | Rs. ’000 | Rs. ’000 | |
| Balance as at January 01, | 4,615,947 | 4,737,125 | 4,222,054 | 4,343,232 |
| Surplus on revaluation of freehold land and buildings | 1,802,333 | – | 1,621,489 | – |
| Deferred tax effect on revaluation surplus on freehold buildings | (171,320) | (121,178) | (120,684) | (121,178) |
| Balance as at December 31, | 6,246,960 | 4,615,947 | 5,722,859 | 4,222,054 |
The revaluation reserve relates to revaluation of freehold land and buildings and represents the fair value changes of the land and buildings as at the date of revaluation.
The Bank carried out a revaluation of all its freehold lands and buildings as at December 31, 2014 and recognised Rs. 1,621.489 Mn. as revaluation surplus.
53.2 General Reserve
| GROUP | BANK | |||
| 2014 | 2013 | 2014 | 2013 | |
| Rs. ’000 | Rs. ’000 | Rs. ’000 | Rs. ’000 | |
| Balance as at January 01, | 22,380,819 | 20,048,989 | 22,380,819 | 20,048,989 |
| Transfer of primary dealer special risk reserve [Refer Note 51.2] | 266,520 | – | 266,520 | – |
| Transfer of investment fund account [Refer Note 53.5] | 5,227,139 | – | 5,227,139 | – |
| Transfers during the year | 4,600,000 | 2,331,830 | 4,600,000 | 2,331,830 |
| Balance as at December 31, | 32,474,478 | 22,380,819 | 32,474,478 | 22,380,819 |
The Bank transfers the surplus profit, after payment of interim dividend and after retaining sufficient profits to pay final dividends proposed, from the retained earnings account to the General Reserve account. The purpose of setting up the General Reserve is to meet potential future unknown liabilities.
53.3 Available-for-Sale Reserve
| GROUP | BANK | |||
| 2014 | 2013 | 2014 | 2013 | |
| Rs. ’000 | Rs. ’000 | Rs. ’000 | Rs. ’000 | |
| Balance as at January 01, | 2,023,468 | 475,467 | 2,054,567 | 475,467 |
| Net fair value gains/(losses) on re-measuring financial investments available-for-sale | 681,002 | 1,576,968 | 681,011 | 1,579,100 |
| Re-classification of retained earnings to/from available for sale reserve | 31,099 | (28,967) | – | – |
| Balance as at December 31, | 2,735,569 | 2,023,468 | 2,735,578 | 2,054,567 |
The available-for-sale reserve comprises the cumulative net change in fair value of financial investment available-for-sale, until such investments are derecognised or impaired.
53.4 Foreign Currency Translation Reserve
| GROUP | BANK | |||
| 2014 | 2013 | 2014 | 2013 | |
| Rs. ’000 | Rs. ’000 | Rs. ’000 | Rs. ’000 | |
| Balance as at January 01, | (393,758) | (755,101) | (406,925) | (757,894) |
| Net gains/(losses) arising from translating the Financial Statements of the foreign operation |
(60,430) | 361,343 | (57,151) | 350,969 |
| Balance as at December 31, | (454,188) | (393,758) | (464,076) | (406,925) |
The foreign currency translation reserve comprises of all foreign currency differences arising from the translation of the Financial Statements of foreign operations.
As at the Reporting date, the assets and liabilities of the Bank’s Bangladesh Operation and Commex - Sri Lanka S.R.L Italy, a subsidiary of the Bank were translated in to the presentation currency (Sri Lankan Rupee) at the exchange rate ruling at the date of the Statement of Financial Position and the Statement of Profit or Loss and Other Comprehensive Income was translated at the average exchange rate for the period. The exchange differences arising on the translation of these Financial Statements are taken directly to foreign currency translation reserve which is classified as a part of equity.
53.5 Investment Fund Reserve
| GROUP | BANK | |||
| 2014 | 2013 | 2014 | 2013 | |
| Rs. ’000 | Rs. ’000 | Rs. ’000 | Rs. ’000 | |
| Balance as at January 01, | 4,838,693 | 2,846,935 | 4,838,693 | 2,846,935 |
| Transfers during the year | 388,446 | 1,991,758 | 388,446 | 1,991,758 |
| Transfers to general reserve [Refer Note 53.2] | (5,227,139) | – | (5,227,139) | – |
| Balance as at December 31, | – | 4,838,693 | – | 4,838,693 |
Banks were required to transfer 8% of the profits calculated for the payment of Value Added Tax (VAT) on financial services and 5% of the profits before tax calculated for the payment of income tax to a fund identified as ‘Investment Fund Account’ (IFA) for a period of three years as per a proposal made in the Government Budget 2011. Since the above-mentioned three-year period has lapsed the Bank transferred the balance in the above reserve fund to the general reserve during 2014.
54. Non-Controlling Interest
| Commercial Development Company PLC | ||
| 2014 | 2013 | |
| Rs. ’000 | Rs. ’000 | |
| Balance as at January 01, | 38,778 | 32,141 |
| Profit for the year | 3,901 | 10,079 |
| Other comprehensive income, net of tax | 7,501 | 12 |
| Dividends paid for the year | (2,616) | (2,616) |
| Deferred tax effect on pre-acquisition reserves | – | (838) |
| Balance as at December 31, | 47,564 | 38,778 |
55. Contingent Liabilities and Commitments
In the normal course of business, the Bank makes various irrevocable commitments and incurs certain contingent liabilities with legal recourse to its customers. Even though these obligations may not be recognised on the date of the Statement of Financial Position, they do contain credit risk and are therefore form part of the overall risk profile of the Bank.
| GROUP | BANK | |||
| As at December 31, | 2014 | 2013 | 2014 | 2013 |
| Rs. ’000 | Rs. ’000 | Rs. ’000 | Rs. ’000 | |
| Contingencies | 244,635,833 | 223,122,029 | 244,635,833 | 223,122,029 |
| Guarantees | 31,068,055 | 26,393,171 | 31,068,055 | 26,393,171 |
| Performance Bonds | 12,038,017 | 8,975,403 | 12,038,017 | 8,975,403 |
| Documentary Credits | 25,286,563 | 20,795,460 | 25,286,563 | 20,795,460 |
| Other contingencies [Refer Note 55.1] | 176,243,198 | 166,957,995 | 176,243,198 | 166,957,995 |
| Commitments | 107,817,619 | 72,329,926 | 107,817,619 | 72,329,926 |
| Undrawn commitments [Refer Note 55.2] | 106,560,178 | 71,240,051 | 106,560,178 | 71,240,051 |
| Capital commitments [Refer Note 55.3] | 1,257,441 | 1,089,875 | 1,257,441 | 1,089,875 |
| Total | 352,453,452 | 295,451,955 | 352,453,452 | 295,451,955 |
55.1 Other Contingencies
| GROUP | BANK | |||
| As at December 31, | 2014 | 2013 | 2014 | 2013 |
| Rs. ’000 | Rs. ’000 | Rs. ’000 | Rs. ’000 | |
| Forward exchange contracts: | 32,246,624 | 84,411,886 | 32,246,624 | 84,411,886 |
| Forward exchange sales | 12,240,936 | 32,057,314 | 12,240,936 | 32,057,314 |
| Forward exchange purchases | 20,005,688 | 52,354,572 | 20,005,688 | 52,354,572 |
| Interest Rate Swap agreements/Currency Options: | 97,645,723 | 50,592,865 | 97,645,723 | 50,592,865 |
| Interest Rate Swaps | – | – | – | – |
| Currency Options | 97,645,723 | 50,592,865 | 97,645,723 | 50,592,865 |
| Others: | 46,350,851 | 31,953,244 | 46,350,851 | 31,953,244 |
| Acceptances | 20,880,240 | 17,682,089 | 20,880,240 | 17,682,089 |
| Bills Sent for Collection | 24,899,607 | 14,012,211 | 24,899,607 | 14,012,211 |
| Stock of Travelers’ Cheques | 476,369 | 258,944 | 476,369 | 258,944 |
| Bullion on Consignment | 94,635 | – | 94,635 | – |
| Sub total | 176,243,198 | 166,957,995 | 176,243,198 | 166,957,995 |
55.2 Undrawn Commitments
| GROUP | BANK | |||
| As at December 31, | 2014 | 2013 | 2014 | 2013 |
| Rs. ’000 | Rs. ’000 | Rs. ’000 | Rs. ’000 | |
| On direct advances | 72,366,848 | 54,249,566 | 72,366,848 | 54,249,566 |
| On indirect advances | 34,193,330 | 16,990,485 | 34,193,330 | 16,990,485 |
| Sub total | 106,560,178 | 71,240,051 | 106,560,178 | 71,240,051 |
55.3 Capital Commitments
The Group has commitments for acquisition of Property, Plant & Equipment and intangible assets incidental to the ordinary course of business which have been approved by the Board of Directors, the details of which are as follows:
| GROUP | BANK | |||
| As at December 31, | 2014 | 2013 | 2014 | 2013 |
| Rs. ’000 | Rs. ’000 | Rs. ’000 | Rs. ’000 | |
| Commitments in relation to property, plant & equipment | 1,226,843 | 1,021,392 | 1,226,843 | 1,021,392 |
| Approved and contracted for | 344,026 | 496,260 | 344,026 | 496,260 |
| Approved but not contracted for | 882,817 | 525,132 | 882,817 | 525,132 |
| Commitments in relation to intangible assets | 30,598 | 68,483 | 30,598 | 68,483 |
| Approved and contracted for | 30,598 | 68,483 | 30,598 | 68,483 |
| Approved but not contracted for | – | – | – | – |
| Sub total | 1,257,441 | 1,089,875 | 1,257,441 | 1,089,875 |
55.4 Commitments of Subsidiaries and Associates
55.4 (a) Contingencies of Subsidiaries
The Subsidiaries of the Group do not have any contingencies as at the Reporting date.
55.4 (b) Contingencies of Associates
The Associates of the Group do not have any contingencies as at the Reporting date.
56. Net Assets Value Per Ordinary Share
| GROUP | BANK | |||
| As at December 31, | 2014 | 2013 | 2014 | 2013 |
| Amounts used as the Numerator: | ||||
| Total equity attributable to equity holders of the Bank (Rs. ’000) | 71,205,835 | 61,446,228 | 70,511,730 | 60,943,999 |
| Number of Ordinary Shares used as the Denominator: | ||||
| Total number of shares | 865,857,675 | 849,079,041 | 865,857,675 | 849,079,041 |
| Net Assets Value per share (Rs.) | 82.24 | 72.37 | 81.44 | 71.78 |
57. Litigation Against the Bank
Litigation is a common occurrence in the banking industry due to the nature of the business. The Bank has an established protocol for dealing with such legal claims. Pending legal claims where the Bank had already made provisions for possible losses in its Financial Statements or has a realisable security to cover the damages are not included below as the Bank does not expect cash outflows from such claims. However, further adjustments are made to Financial Statements if necessary on the adverse effects of legal claims based on the professional advice obtained on the certainty of the outcome and also based on a reasonable estimate.
Set out below are unresolved legal claims against the Bank as at December 31, 2014 for which, adjustments to the Financial Statements have not been made due to the uncertainty of its outcome.
- Court action has been initiated by a third party in District Court, Colombo proceeding number 0122/2009/DLM to claim the title of a property which has been mortgaged to the Bank by the present owner who is our customer, for several facilities granted. The value of action is Rs. 85.000 Mn. Court granted permission to proceed and thereafter the plaint was amended by the plaintiff. The plaintiff gave evidence in two trial sessions in 2014. Submissions of other parties are due on March 4, 2015 and trial is fixed accordingly.
- Court action has been initiated by a customer in High Court Civil Case number 236/2011/MR challenging the Bank for transferring a vehicle in the name of a relation of the customer, upon settlement of a lease facility obtained from the Bank. The Bank has executed the transfer on the strength of a letter issued by the plaintiff who is now challenging the letter. The value of the action is Rs. 3.500 Mn. Next trial is fixed for June 18, 2015.
- Court action has been initiated by a customer in proceeding number 25831/MR to claim a sum of Rs. 2.880 Mn including the interest of an overdraft facility. The judgment was entered against the Bank in the District Court for Rs. 1.874 Mn. The Bank has appealed (Appeal No. 133/2010) to the Supreme Court. Argument fixed for May 06, 2015.
- Court action has been initiated by the plaintiff in the Commercial High Court of the Western Province case number 571/2008/MR to prevent the Bank from exercising the right of lien and set off a deposit of the plaintiff amounting to US$ 15.000 Mn. against a claim made by the Bank in terms of a hedging agreement. Commercial High Court issued the judgment in favour of the Bank and dismissed plaintiff’s application for an interim injunction. Presently the case is at the Trial stage. Next trial date fixed for June 25, 2015.
- Court action has been initiated by a third party in Colombo High Court proceedings number 112/2005 (1) to claim Rs. 5.584 Mn. plus Rs. 10.000 Mn. as damages for disposing of the shares owned by her which were held under lien to the Bank. Plaintiff alleges that the transaction has taken place without obtaining her consent. Judgment was delivered in favour of the Plaintiff. Bank has appealed to the Supreme Court (Appeal No. 09/2010) against the judgment delivered. The plaintiff has filed an application for the issue of Writ Pending Appeal. Bank had agreed to issue a guarantee for Rs. 5.000 Mn. in favour of the plaintiff, to be claimed only on the final determination of the appeal by the Supreme Court.
- Court action has been initiated by a customer in Colombo High Court Case number 36/96 (1) to claim a sum of Rs. 183.050 Mn. on account of a forward exchange contract. Judgment was delivered in favour of the Bank dismissing the plaintiff’s action, but the plaintiff has appealed against the judgment in the Supreme Court (Appeal No. 38/2006). The appeal is fixed for argument on March 18, 2015.
- Court action has been initiated by a customer for Rs. 14.000 Mn. in District Court, Colombo proceeding number DMR 3/2014 to recover a sum of Rs. 13.063 Mn. including interest on cheques paid with a fraudulent signature. Trial fixed for April 27, 2015.
- Court action has been initiated by a customer in proceedings number 52/10 to claim a sum of BDT 35.328 Mn. (approx. Rs. 59.514 Mn.) from the Bank for illegal withdrawal of money from their account by issuing cheques with forged signatures. The Bank refuses the claim of the customer as the Bank is of the view that it had acted in good faith, without negligence and also that the Bank is not responsible for any losses incurred due to inadequacy of the security of cheque books issued to the customer. Next date of the case is fixed for May 4, 2015.
58. Maturity Analysis
(a) Group
(i) Remaining contractual period to maturity as at the date of Statement of Financial Position of the assets employed by the Group is detailed below:
| Up to 3 Months |
3 to 12 Months |
1 to 3 Years |
3 to 5 Years |
More than 5 Years |
Total as at 31.12.2014 |
Total as at 31.12.2013 |
|
| Rs. ’000 | Rs. ’000 | Rs. ’000 | Rs. ’000 | Rs. ’000 | Rs. ’000 | Rs. ’000 | |
| Interest earning assets: | |||||||
| Financial Assets | |||||||
| Cash and cash equivalents | 3,601,722 | – | – | – | – | 3,601,722 | 135,564 |
| Balances with Central Banks | 142,927 | 24,569 | – | – | – | 167,496 | 807 |
| Placements with banks | 13,450,661 | 1,057,200 | – | – | – | 14,507,861 | 4,131,814 |
| Other financial instruments held-for-trading |
5,958,902 | – | – | – | – | 5,958,902 | 6,044,652 |
| Loans and receivables to other customers |
206,471,775 | 92,420,724 | 114,995,160 | 57,546,738 | 26,731,022 | 498,165,419 | 410,935,979 |
| Financial investments - Available-for-sale |
14,825,840 | 43,160,275 | 30,542,371 | 72,261,471 | 52,591,431 | 213,381,388 | 131,707,597 |
| Total interest earning assets as at 31.12.2014 |
244,451,827 | 136,662,768 | 145,537,531 | 129,808,209 | 79,322,453 | 735,782,788 | – |
| Total interest earning assets as at 31.12.2013 |
222,769,321 | 128,182,669 | 124,440,085 | 53,925,344 | 23,638,995 | 552,956,413 | |
| Non-interest earning assets: | |||||||
| Financial Assets | |||||||
| Cash and cash equivalents | 17,020,056 | – | – | – | – | 17,020,056 | 14,127,969 |
| Balances with Central Banks | 13,455,116 | 4,963,785 | 428,783 | 276,983 | 341,583 | 19,466,250 | 18,431,129 |
| Derivative financial instruments | 193,541 | 265,472 | 497 | – | – | 459,510 | 837,694 |
| Other financial instruments held-for-trading |
367,734 | – | – | – | – | 367,734 | 334,406 |
| Loans and receivables to banks | – | – | 551,066 | – | – | 551,066 | 546,270 |
| Financial investments - Available-for-sale |
613,440 | – | – | 15,864 | 214,325 | 843,629 | 48,928 |
| Non-Financial Assets | |||||||
| Investments in associates | – | – | – | – | 106,287 | 106,287 | 94,173 |
| Property, plant & equipment | – | – | – | – | 11,134,861 | 11,134,861 | 9,175,225 |
| Intangible assets | – | – | – | – | 856,230 | 856,230 | 477,728 |
| Leasehold property | – | – | – | – | 108,872 | 108,872 | 110,324 |
| Other assets | 6,567,455 | 206,471 | 481,335 | 987,110 | 2,318,059 | 10,560,430 | 9,424,248 |
| Total non-interest earning assets as at 31.12.2014 |
38,217,342 | 5,435,728 | 1,461,681 | 1,279,957 | 15,080,217 | 61,474,925 | |
| Total non-interest earning assets as at 31.12.2013 |
32,736,057 | 5,886,851 | 1,337,899 | 730,707 | 12,916,580 | 53,608,094 | |
| Total assets - as at 31.12.2014 |
282,669,167 | 142,098,496 | 146,999,212 | 131,088,166 | 94,402,670 | 797,257,713 | |
| Total assets - as at 31.12.2013 |
255,505,378 | 134,069,520 | 125,777,984 | 54,656,051 | 36,555,575 | 606,564,507 | |
| Percentage - as at 31.12.2014(*) |
35.46 | 17.82 | 18.44 | 16.44 | 11.84 | 100.00 | |
| Percentage - as at 31.12.2013(*) |
42.12 | 22.10 | 20.74 | 9.01 | 6.03 | 100.00 |
(*) Total percentage of each maturity bucket out of total assets employed by the Group.
(ii) Remaining contractual period to maturity as at the date of Statement of Financial Position of the liabilities and shareholders’ funds employed by the Group is detailed below:
| Up to 3 Months |
3 to 12 Months |
1 to 3 Years |
3 to 5 Years |
More than 5 Years |
Total as at 31.12.2014 |
Total as at 31.12.2013 |
|
| Rs. ’000 | Rs. ’000 | Rs. ’000 | Rs. ’000 | Rs. ’000 | Rs. ’000 | Rs. ’000 | |
| Interest-bearing liabilities: | |||||||
| Financial Liabilities | |||||||
| Due to banks | 2,595,675 | 4,893,632 | 20,097 | – | 7,509,404 | 12,195,006 | |
| Due to other customers/Deposits from customers |
322,082,257 | 134,418,721 | 12,675,981 | 6,566,010 | 8,602,013 | 484,344,982 | 415,328,039 |
| Other borrowings | 84,265,796 | 41,433,870 | 6,907,267 | 2,244,110 | 1,176,582 | 136,027,625 | 53,997,503 |
| Subordinated liabilities | 132,371 | 331,323 | 987,855 | – | 9,811,024 | 11,262,573 | 10,944,412 |
| Total interest-bearing liabilities as at 31.12.2014 |
409,076,099 | 181,077,546 | 20,591,200 | 8,810,120 | 19,589,619 | 639,144,584 | – |
| Total interest-bearing liabilities as at 31.12.2013 |
304,889,324 | 141,552,936 | 14,342,812 | 11,467,136 | 20,222,752 | 492,464,960 | |
| Non-interest-bearing liabilities: | |||||||
| Financial Liabilities | |||||||
| Due to banks | 18,159,621 | – | – | – | – | 18,159,621 | 1,999,213 |
| Derivative financial instruments | 733,669 | 459,470 | – | – | – | 1,193,139 | 1,411,916 |
| Due to other customers/Deposits from customers |
44,921,666 | – | – | – | – | 44,921,606 | 35,770,907 |
| Non-Financial Liabilities | |||||||
| Current tax liabilities | 1,054,008 | 974,709 | 8,671 | – | – | 2,037,388 | 1,780,867 |
| Deferred tax liabilities | 241,710 | 229,570 | 722,301 | 1,209,746 | 472,872 | 2,876,199 | 1,763,414 |
| Other provisions | 1,874 | – | – | – | – | 1,874 | 2,409 |
| Other liabilities | 9,276,201 | 4,504,379 | 2,381,158 | 558,205 | 949,960 | 17,669,903 | 9,885,815 |
| Equity | |||||||
| Stated capital | – | – | – | – | 21,457,501 | 21,457,501 | 19,586,813 |
| Statutory reserves | – | – | – | – | 4,327,103 | 4,327,103 | 4,034,614 |
| Retained earnings | – | – | – | – | 4,418,412 | 4,418,412 | 4,359,632 |
| Other reserves | – | – | – | – | 41,002,819 | 41,002,819 | 33,465,169 |
| Non-controlling interest | 47,564 | 47,564 | 38,778 | ||||
| Total non-interest bearing liabilities as at 31.12.2014 |
74,388,689 | 6,168,127 | 3,112,130 | 1,767,951 | 72,676,231 | 158,113,129 | |
| Total non-interest-bearing liabilities as at 31.12.2013 |
46,840,608 | 2,180,945 | 1,639,486 | 765,427 | 62,673,081 | 114,099,547 | |
| Total liabilities and equity - as at 31.12.2014 |
483,464,789 | 187,245,674 | 23,703,330 | 10,578,071 | 92,265,850 | 797,257,713 | |
| Total liabilities and equity - as at 31.12.2013 |
351,729,932 | 143,723,881 | 15,982,298 | 12,232,563 | 82,895,833 | 606,564,507 | |
| Percentage - as at 31.12.2014(*) |
60.64 | 23.49 | 2.97 | 1.33 | 11.57 | 100.00 | |
| Percentage - as at 31.12.2013(*) |
57.99 | 23.69 | 2.63 | 2.02 | 13.67 | 100.00 |
(*) Total percentage of each maturity bucket out of total liabilities and shareholders’ funds employed by the Group.
(b) Bank
Maturity analysis of the asset and liabilities of the Bank is given in Note 65 on ‘Financial Risk Review’.
59. Operating Segments
The Group has the following strategic business divisions which are reportable segments. These divisions offer different products and services and are managed separately based on the Group’s management and internal reporting structure.
The following table presents the income, profit and asset and liability information on the group’s strategic business divisions for the year ended December 31, 2014 and comparative figures for the year ended December 31, 2013.
| Retail Banking | Corporate Banking | International Operations | Investment Banking | Dealing/Treasury | Total/Consolidated | |||||||
| For the year ended December 31, |
2014 | 2013 | 2014 | 2013 | 2014 | 2013 | 2014 | 2013 | 2014 | 2013 | 2014 | 2013 |
| Rs. ’000 | Rs. ’000 | Rs. ’000 | Rs. ’000 | Rs. ’000 | Rs. ’000 | Rs. ’000 | Rs. ’000 | Rs. ’000 | Rs. ’000 | Rs. ’000 | Rs. ’000 | |
| External Operating income: |
||||||||||||
| Net interest income |
21,439,625 | 20,197,758 | 4,853,574 | 4,820,251 | 1,678,943 | 1,452,620 | 301,842 | 231,542 | (954,160) | (803,228) | 27,319,824 | 25,898,943 |
| Foreign exchange profit |
186,537 | 319,911 | 169,464 | 145,046 | 452,274 | 455,442 | – | – | 672,898 | 1,075,217 | 1,481,173 | 1,995,616 |
| Net fees and commission income |
2,897,758 | 2,490,385 | 1,423,382 | 1,281,801 | 522,241 | 471,843 | – | – | 5,981 | 8,829 | 4,849,362 | 4,252,858 |
| Other income | 2,180,092 | 1,835,798 | 217,483 | 233,536 | 88,717 | 72,619 | 152,487 | 830,318 | 2,523,845 | 759,659 | 5,162,624 | 3,731,930 |
| Eliminations/ unallocated |
347,575 | 342,730 | ||||||||||
| Total operating income | 26,704,012 | 24,843,852 | 6,663,903 | 6,480,634 | 2,742,175 | 2,452,524 | 454,329 | 1,061,860 | 2,248,564 | 1,040,477 | 39,160,558 | 36,222,077 |
| Credit loss expenses |
(3,447,804) | (4,048,513) | (1,111,385) | (1,093,363) | (339,060) | (35,143) | – | – | – | – | (4,898,249) | (5,177,019) |
| Net operating income |
23,256,208 | 20,795,339 | 5,552,518 | 5,387,271 | 2,403,115 | 2,417,381 | 454,329 | 1,061,860 | 2,248,564 | 1,040,477 | 34,262,309 | 31,045,058 |
| Segment result | 11,372,329 | 10,073,230 | 5,829,292 | 5,606,741 | 2,457,544 | 1,911,800 | 398,534 | 948,090 | 920,663 | 495,852 | 20,978,362 | 19,035,713 |
| Unallocated operating expenses | (5,125,008) | (4,350,080) | ||||||||||
| Profit from operations | 15,853,354 | 14,685,633 | ||||||||||
| Share of profit of associates, net of tax | 6,563 | 5,285 | ||||||||||
| Income tax expense | (4,617,124) | (4,117,461) | ||||||||||
| Non-controlling interest | (3,901) | (10,079) | ||||||||||
| Net profit for the year, attributable to Equity holders of the parent | 11,238,892 | 10,563,378 | ||||||||||
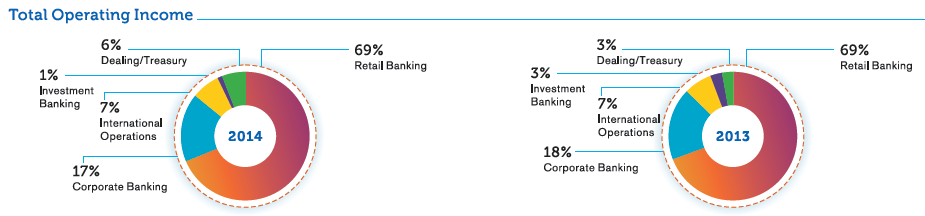
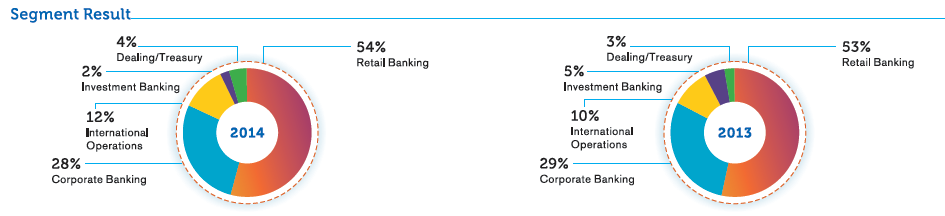
| Retail Banking | Corporate Banking | International Operations | Investment Banking | Dealing/Treasury | Total/Consolidated | |||||||
| As at December 31, |
2014 | 2013 | 2014 | 2013 | 2014 | 2013 | 2014 | 2013 | 2014 | 2013 | 2014 | 2013 |
| Rs. ’000 | Rs. ’000 | Rs. ’000 | Rs. ’000 | Rs. ’000 | Rs. ’000 | Rs. ’000 | Rs. ’000 | Rs. ’000 | Rs. ’000 | Rs. ’000 | Rs. ’000 | |
| Other information | ||||||||||||
| Segment assets | 211,546,670 | 181,619,318 | 182,635,036 | 152,747,967 | 51,555,583 | 46,175,311 | 10,184,101 | 4,902,005 | 311,035,860 | 192,541,792 | 766,957,250 | 577,986,393 |
| Investment in associates |
– | – | – | – | – | – | 106,287 | 94,173 | – | – | 106,287 | 94,173 |
| Unallocated Assets |
– | – | – | – | – | – | – | – | – | – | 30,194,176 | 28,483,941 |
| Total assets | 211,546,670 | 181,619,318 | 182,635,036 | 152,747,967 | 51,555,583 | 46,175,311 | 10,290,388 | 4,996,178 | 311,035,860 | 192,541,792 | 797,257,713 | 606,564,507 |
| Segment liabilities | 254,588,314 | 219,338,258 | 102,815,075 | 87,885,244 | 42,361,090 | 36,258,425 | 10,290,388 | 4,996,178 | 311,035,860 | 192,541,792 | 721,090,727 | 541,019,897 |
| Unallocated liabilities |
– | – | – | – | – | – | – | – | – | – | 4,913,587 | 4,059,604 |
| Total liabilities | 254,588,314 | 219,338,258 | 102,815,075 | 87,885,244 | 42,361,090 | 36,258,425 | 10,290,388 | 4,996,178 | 311,035,860 | 192,541,792 | 726,004,314 | 545,079,501 |
| Information on cash flows |
||||||||||||
| Cash flows from operating activities |
111,174,633 | 66,345,141 | (6,853,886) | (10,528,327) | 2,459,720 | 1,421,827 | 887,815 | (623,719) | (88,902,894) | (65,138,079) | 18,765,388 | (8,523,157) |
| Cash flows from investing activities |
– | – | – | – | – | – | (6,795,464) | (1,025,995) | (6,795,464) | (1,025,995) | ||
| Cash flows from financing activities |
(618,493) | 9,108,100 | – | – | – | – | – | – | (130,697) | (132,645) | (749,190) | 8,975,455 |
| Capital expenditure | – | – | ||||||||||
| Property, plant & equipment | (1,038,931) | (925,721) | ||||||||||
| Intangible assets | (144,494) | (119,903) | ||||||||||
| Eliminations/unallocated | (3,679,064) | (3,869,351) | ||||||||||
| Net cash flow generated during the year | 6,358,245 | (5,488,672) | ||||||||||
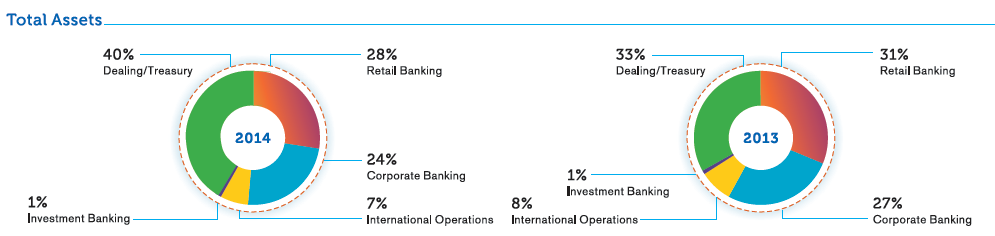
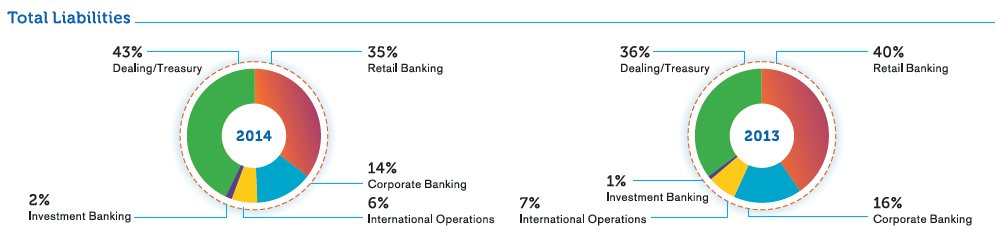
60. Related Party Disclosures
The Bank carried out transactions in the ordinary course of business on an arm’s length basis at commercial rates with parties who are defined as Related Parties as per the Sri Lanka Accounting Standard – LKAS 24 ‘Related Party Disclosures’, except for the transactions that the Key Management Personnel (KMPs) have availed under schemes uniformly applicable to all staff at concessionary rates.
60.1 Parent and Ultimate Controlling Party
The Bank does not have an identifiable parent of its own.
60.2 Transactions with Key Management Personnel (KMPs)
Key Management Personnel are those persons having authority and responsibility for planning, directing and controlling the activities of the entity directly or indirectly.
KMPs of the Bank
The Board of Directors (including executive and non-executive) of the Bank has been classified as KMPs of the Bank.
KMPs of the Group
As the Bank is the ultimate parent of the Subsidiaries listed out on page 408, the Board of Directors of the Bank has the authority and responsibility for planning, directing and controlling the activities of the Group directly or indirectly. Accordingly, the Board of Directors of the Bank (Including executive and non-executive) is also KMPs of the Group. Therefore, officers who are only Directors of the subsidiaries and not of the Bank have been classified as KMPs of that respective subsidiary only.
| For the year ended December 31, | 2014 | 2013 |
| Rs. ’000 | Rs. ’000 | |
60.2.1.1 Compensation of KMPs – Bank |
||
| Short term employment benefits | 110,065 | 96,115 |
| Post-employment benefits | 7,010 | 5,463 |
| Total | 117,075 | 101,578 |
60.2.1.2 Compensation of KMPs – Group |
||
| Short term employment benefits | 110,505 | 96,437 |
| Post-employment benefits | 7,010 | 5,463 |
| Total | 117,515 | 101,900 |
In addition to the above, the Bank/Group provide non-cash benefits to the KMPs.
60.2.2 Transactions, Arrangements and Agreements Involving KMPs, and their CFMs
CFMs of a KMP are those family members who may be expected to influence, or be influenced by, that KMP in their dealings with the entity. They may include KMPs domestic partner and children, children of the KMPs domestic partner and dependents of the KMP or the KMPs domestic partner.
60.2.2.1 Statement of Financial Position – Bank
No impairment losses have been recorded against balances outstanding with KMPs and CFMs.
60.2.2.4 Income Statement
| For the Year Ended December 31, | 2014 | 2013 |
| Rs. ’000 | Rs. ’000 | |
| Interest income | 291 | 424 |
| Interest expenses | 6,553 | 8,490 |
| Other income | 80 | 69 |
| Compensation to KMPs [Refer Notes 60.2.1.1 and 60.2.1.2] | 117,075 | 101,578 |
60.2.2.5 Share-Based Benefits to KMPs
| As at the Year End | 2014 | 2013 | |
| Number of ordinary shares held | 619,454 | 1,114,056 | |
| Dividends paid (in Rs. ’000) | 7,741 | 7,120 | |
| Number of cumulative exercisable options under the Employee Share Option Plan (ESOP) 2008 - Tranche I |
50,231 | 101,087 | |
| Tranche II | 148,016 | 55,076 | |
| Tranche III | 103,736 | 60,512 |
60.3 Transactions with Group Entities
The Group entities include the Subsidiaries and Associates of the Bank.
60.3.1 Transactions with Subsidiaries
60.3.1.1 Statement of Financial Position
| Year-end balance | Average balance | |||
| 2014 | 2013 | 2014 | 2013 | |
| Rs. ’000 | Rs. ’000 | Rs. ’000 | Rs. ’000 | |
| Assets | ||||
| Loans and advances | 586,800 | – | 213,738 | 1,478 |
| Lease receivable | 2,205 | 16,965 | 7,128 | 32,736 |
| Other receivables | 85,685 | 75,540 | 80,613 | 70,813 |
| Impairment for other receivables | (51,398) | (41,036) | (46,217) | (34,632) |
| Total | 623,292 | 51,469 | 255,262 | 70,395 |
| Liabilities | ||||
| Deposits | 94,896 | 53,937 | 80,391 | 60,395 |
| Securities sold under re-purchase agreements | 173,457 | 175,672 | 161,516 | 174,998 |
| Other | 19,289 | 15,686 | 17,487 | 18,975 |
| Total | 287,642 | 245,295 | 259,394 | 254,368 |
60.3.1.2 Commitments and Contingencies |
||||
| Undrawn facilities | 100,000 | – | 25,339 | 15,638 |
| Total | 100,000 | – | 25,339 | 15,638 |
60.3.1.3 Direct and Indirect Accommodation |
||||
| Direct and indirect accommodation as a percentage of the Bank’s Regulatory Capital | 1.00% | 0.03% | ||
60.3.1.4 Income Statement
| For the Year Ended December 31, | 2014 | 2013 |
| Rs. ’000 | Rs. ’000 | |
| Interest income | 17,608 | 7,244 |
| Interest expenses | 35,080 | 23,550 |
| Other income | 70,482 | 70,465 |
| Impairment charges | 10,362 | 12,809 |
| Expenses paid | 379,463 | 345,007 |
60.3.1.5 Other Transactions |
||
| Payments made to ONEzero Company Ltd. in relation to purchase of computer hardware and software | 30,312 | 29,327 |
60.3.2 Transactions with Associates
60.3.2.1 Statement of Financial Position
| Year-end Balance | Average Balance | |||
| 2014 | 2013 | 2014 | 2013 | |
| Rs. ’000 | Rs. ’000 | Rs. ’000 | Rs. ’000 | |
| Assets | ||||
| Loans and advances | – | 11 | 227 | 22 |
| Lease receivables | 127 | 1,010 | 393 | 3,988 |
| Total | 127 | 1,021 | 620 | 4,010 |
| Liabilities | ||||
| Deposits | 22,331 | 78,600 | 25,900 | 43,087 |
| Securities sold under repurchase agreements | 5,771 | 6,840 | 490 | 14,300 |
| Total | 28,102 | 85,440 | 26,390 | 57,387 |
60.3.2.2 Direct and Indirect Accommodation |
||||
| Direct and Indirect Accommodation as a % of the Bank’s Regulatory Capital | 0.00% | 0.00% | ||
60.3.2.3 Income Statement
| For the Year Ended December 31, | 2014 | 2013 |
| Rs. ’000 | Rs. ’000 | |
| Interest income | 104 | 615 |
| Interest expenses | 1,627 | 6,112 |
| Other income | 19,003 | 20,975 |
60.3.2.4 Other Transactions |
||
| Number of ordinary shares of the Bank held by the associates as at the year end | 4,485 | 4,408 |
| Dividend paid (Rs. ’000) | 29 | 28 |
60.4 Transactions with Other Related Entities
Other related entities include significant investors (either entities or individuals) that have control, joint control or significant influence, post-employment benefit plans for the Bank’s employees.
60.4.1 Transactions with the Post-Employment Benefit Plans for the Employees of the Bank
60.4.1.1 Statement of Financial Position
| Year-end Balance | Average Balance | |||
| 2014 | 2013 | 2014 | 2013 | |
| Rs. ’000 | Rs. ’000 | Rs. ’000 | Rs. ’000 | |
| Assets | ||||
| Loans and Advances | – | – | – | – |
| Total | – | – | – | – |
| Liabilities | ||||
| Deposits | 4,293,158 | 2,296,724 | 2,559,011 | 1,512,629 |
| Securities sold under re-purchase agreements | 1,171 | 60,042 | 769 | 11,906 |
| Total | 4,294,329 | 2,356,766 | 2,559,780 | 1,524,535 |
60.4.1.2 Income Statement
| For the Year Ended December 31, | 2014 | 2013 |
| Rs. ’000 | Rs. ’000 | |
| Interest income | – | – |
| Interest expenses | 280,831 | 197,602 |
| Contribution made/taxes paid by the Bank | 901,433 | 795,675 |
61. Non-Cash Items Included in Profit Before Tax
63. Change in Operating Liabilities
| GROUP | BANK | |||
| As at December 31, | 2014 | 2013 | 2014 | 2013 |
| Rs. ’000 | Rs. ’000 | Rs. ’000 | Rs. ’000 | |
| Net increase/(decrease) in due to banks | 10,436,070 | 9,300,274 | 11,066,757 | 9,300,274 |
| Net increase/(decrease) in derivative financial instruments | (218,777) | 1,327,625 | (218,777) | 1,327,625 |
| Net increase/(decrease) in deposits from banks, customers and debt securities issued | 78,167,642 | 60,530,264 | 78,208,561 | 60,541,375 |
| Net increase/(decrease) in other borrowings | 82,030,122 | 6,561,938 | 82,027,907 | 6,590,356 |
| Net increase/(decrease) in other provisions | (535) | – | (535) | – |
| Net increase/(decrease) in other liabilities | 7,453,105 | (837,271) | 7,393,572 | (837,156) |
| Net increase/(decrease) in due to Subsidiaries | – | – | 3,603 | (6,578) |
| Total | 177,867,627 | 76,882,830 | 178,481,088 | 76,915,896 |
64. Operating Leases
64.1 Operating Lease Commitments (Payables)
The Group has leased a number of office premises under operating leases. These leases have an average life of between three to five years. Lease agreements include clauses to enable upward revision of the rental payments on a periodic basis to reflect market conditions. There are no restrictions placed upon the Group by entering into these leases.
Future minimum rentals payable under non-cancellable operating leases are as follows:
| GROUP | BANK | |||
| As at December 31, | 2014 | 2013 | 2014 | 2013 |
| Rs. ’000 | Rs. ’000 | Rs. ’000 | Rs. ’000 | |
| Less than one year | 510,968 | 470,050 | 507,386 | 572,831 |
| Between one and five years | 1,400,091 | 1,380,118 | 1,395,852 | 1,380,118 |
| More than five years | 686,146 | 789,219 | 686,146 | 789,219 |
| Total | 2,597,205 | 2,639,387 | 2,589,384 | 2,742,168 |
64.2 Operating lease commitments (Receivables)
The Group has entered into commercial property leases on its own properties, mainly consisting of areas not currently occupied by the branches. Lease agreements include clauses to enable upward revision of rental income on a periodic basis to reflect market conditions. These leases have an average life of between three to five years. There are no restrictions placed upon the Group by entering into these leases.
Future minimum rentals receivable under non-cancellable operating leases are as follows:
| GROUP | BANK | |||
| As at December 31, | 2014 | 2013 | 2014 | 2013 |
| Rs. ’000 | Rs. ’000 | Rs. ’000 | Rs. ’000 | |
| Less than one year | 7,579 | 11,250 | 6,679 | 8,680 |
| Between one and five years | 7,940 | 15,519 | 7,445 | 14,124 |
| More than five years | – | – | – | – |
| Total | 15,519 | 26,769 | 14,124 | 22,804 |
65. Financial Risk Review
As required by the provisions of the SLFRS 07 on ‘Financial Instrument: Disclosure’, this Note presents information about the Bank’s exposure to financial risks and the Bank’s management of capital.
| For Information on the Bank’s Financial Risk Management Framework | Page No. | |
Introduction |
||
| 65.1 | Credit Risk | |
| 65.1.1 | Credit Quality Analysis | 381 |
| 65.1.2 | Impaired Loans and Receivables and Investment Debt Securities | 388 |
| 65.1.3 | Collateral Held | 388 |
| 65.1.4 | Concentrations of Credit Risk | 389 |
| 65.1.5 | Exposures to Unrated Countries | 393 |
| 65.2 | Liquidity Risk | |
| 65.2.1 | Exposure to Liquidity Risk | 393 |
| 65.2.2 | Maturity Analysis of Financial Assets and Financial Liabilities | 394 |
| 65.2.3 | Liquidity Reserves | 397 |
| 65.2.4 | Financial Assets Available to Support Future Funding | 397 |
| 65.3 | Market Risk | |
| 65.3.1 | Exposure to Market Risk - Trading and Non-Trading Portfolios | 398 |
| 65.3.2 | Exposure to Interest Rate Risk - Sensitivity Analysis | 399 |
| 65.3.3 | Exposure to Currency Risks - Non-Trading Portfolios | 402 |
| 65.3.4 | Exposure to Equity Price Risk | 403 |
| 65.4 | Operational Risk | |
| 65.5 | Capital Management | |
| 65.5.1 | Regulatory Capital | 404 |
| 65.5.2 | Capital Allocation | 405 |
Introduction
As a financial intermediary, the Bank is exposed to various types of risks including credit, market, liquidity and operational risks which are inherent in the Bank’s activities. Managing these risks is critical for the sustainability of the Bank and plays a pivotal role in all activities of the Bank. Risk management function strives to identify potential risks in advance, analyse them and take precautionary steps to mitigate the impact of risk whilst optimising through risk adjusted returns within the risk appetite of the Bank.
Risk Management Framework
The overall responsibility and oversight of the risk management framework of the Bank is vested with the Board of Directors (BOD). The Board Integrated Risk Management Committee (BIRMC) a mandatory Sub-Committee set-up by the Board, in turn is entrusted with development of the Bank’s risk management policies and monitoring of due compliance of same through the Executive Integrated Risk Management Committee (EIRMC).
The risk management policies spell out the risk appetite of the Bank and has incorporated risk exposure limits and controls to monitor adherence to the limits in force. These Policies and systems are reviewed regularly to reflect the changing market conditions and the products and services offered.
The Bank strives to inculcate a risk management culture through continuous training, work ethics and standards.
Refer Note 3 on page 281 for more information on the risk management framework of the Bank.
Integrated Risk Management Department (IRMD)
Business units are the risk owners and have the primary responsibility for risk management. The IRMD acts as the second line of defense in managing the risk. The IRMD through Chief Manager - Risk reports to BIRMC thus ensuring its independence.
Risk Measurement and Reporting
The Bank uses robust risk measurement techniques based on the type of risk and industry best practices. The Bank also carries out Stress Testing which is a key aspect of the Internal Capital Adequacy Assessment Process (ICAAP) and the risk management framework and provides insight on the impact of extreme but plausible scenarios on the Bank’s risk profile. The results are reported to the EIRMC and to the BIRMC on a periodic basis.
The Bank establishes policies, limits and thresholds within the risk appetite. These limits reflect the business strategy and market environment of the Bank as well as the level of risk that the Bank is willing to accept (risk appetite). The monitoring and control mechanism therefore is based on risk appetite of the Bank.
65.1 Credit Risk
The financial loss resulting from a borrower or counterparty to a financial instrument failing or delaying to meet its contractual obligations is referred to as credit risk. It arises principally from the Bank’s loans and receivables to banks and other customers and investments in debt securities. In addition to the credit risk from direct funding exposure i.e., on Balance Sheet exposure, indirect liabilities such as Letters of Credit, Guarantees etc. also would expose the Bank to credit risk.
The Bank considers and consolidates all elements of credit risk exposure (such as individual obligor default risk, country and sector concentration risks) to ensure stringent credit risk management.
65.1.1 Credit Quality Analysis
65.1.1 (a) Maximum Exposure to Credit Risk
The table below set out information about the maximum exposure to credit risk (including off-balance sheet exposure) broken down by risk grades and the related provision for impairment made by the Bank against those assets.
| As at December 31, | Note | Loans and Receivables to Other Customers |
Loans and Receivables to Banks |
Financial Investments | Lending Commitments and Financial Guarantees | ||||
| 2014 | 2013 | 2014 | 2013 | 2014 | 2013 | 2014 | 2013 | ||
| Rs. ’000 | Rs. ’000 | Rs. ’000 | Rs. ’000 | Rs. ’000 | Rs. ’000 | Rs. ’000 | Rs. ’000 | ||
| Maximum Exposure to Credit Risk | |||||||||
| Carrying amount | 30-33, 55 | 497,065,787 | 410,951,440 | 551,066 | 546,270 | 220,535,006 | 138,135,583 | – | – |
| Amount Committed/Guarantees | – | – | – | – | – | – | 351,196,011 | 294,362,080 | |
| At Amortised Cost | |||||||||
| Government Securities (Risk Free Investments) |
82,048,277 | 52,055,196 | – | – | – | – | – | – | |
| Rating 0-4: Investment Grade(*) |
232,627,091 | 189,905,906 | 551,066 | 546,270 | – | – | – | – | |
| Rating 5-6: Moderate Risk | 177,468,590 | 164,685,855 | – | – | – | – | – | – | |
| Rating S: High Risk | 2,791,464 | 2,142,597 | – | – | – | – | – | – | |
| Rating 7-9: Extreme Risk | 19,086,939 | 17,949,054 | – | – | – | – | – | – | |
| Gross carrying amount | 514,022,361 | 426,738,608 | 551,066 | 546,270 | – | – | – | – | |
| Less: Provision for impairment (individual and collective) |
16,956,574 | 15,787,168 | – | – | – | – | – | – | |
| Net carrying amount | 31, 32 | 497,065,787 | 410,951,440 | 551,066 | 546,270 | – | – | – | – |
| Available-for-sale | |||||||||
| Government Securities (Risk Free Investments) |
– | – | – | – | 205,160,033 | 123,597,457 | – | – | |
| Rating 0-4: Investment Grade |
– | – | – | – | 843,630 | 190,584 | – | – | |
| Rating 5-6: Moderate Risk | – | – | – | – | 8,204,707 | 7,968,484 | – | – | |
| Rating S: High Risk | – | – | – | – | – | – | – | – | |
| Rating 7-9: Extreme Risk | – | – | – | – | – | – | – | – | |
| Gross/net carrying amount | 33 | – | – | – | – | 214,208,370 | 131,756,525 | – | – |
| At Fair Value through Profit or Loss |
|||||||||
| Government Securities (Risk Free Investments) |
– | – | – | – | 2,423,272 | 4,058,644 | – | – | |
| Rating 0-4: Investment Grade |
– | – | – | – | 367,732 | 334,407 | – | – | |
| Rating 5-6: Moderate Risk | – | – | – | – | 3,535,632 | 1,986,007 | – | – | |
| Rating S: High Risk | – | – | – | – | – | – | – | – | |
| Rating 7-9: Extreme Risk | – | – | – | – | – | – | – | – | |
| Gross/net carrying amount | 30 | 6,326,636 | 6,379,058 | ||||||
| Total net carrying amount | 497,065,787 | 410,951,440 | 551,066 | 546,270 | 220,535,006 | 138,135,583 | – | – | |
| Off-Balance Sheet(**) | |||||||||
| Maximum Exposure | |||||||||
| Lending Commitments | |||||||||
| Rating 0-6: Investment Grade to Moderate Risk |
– | – | – | – | – | – | 106,560,178 | 71,240,051 | |
| Financial Guarantees | |||||||||
| Rating 0-6: Investment Grade to Moderate Risk |
– | – | – | – | – | – | 244,635,833 | 223,122,029 | |
| Total exposure | 55 | – | – | – | – | – | – | 351,196,011 | 294,362,080 |
(**) Amounts reported above do not include Capital Commitments Disclosed in the Note 55 on ‘Contingent Liabilities and Commitments’ on page 367.
65.1.1 (b) Age Analysis by Class of Financial Assets
The maximum exposure to credit risk for class of financial assets by risk rating and by age are given below:
| Loans and Receivables to Other Customers |
Loans and Receivables to Banks |
Financial Investment | Lending Commitments and Financial Guarantees | |||||
| As at December 31, | 2014 | 2013 | 2014 | 2013 | 2014 | 2013 | 2014 | 2013 |
| Rs. ’000 | Rs. ’000 | Rs. ’000 | Rs. ’000 | Rs. ’000 | Rs. ’000 | Rs. ’000 | Rs. ’000 | |
| Government Securities (Risk Free investments) |
82,048,277 | 52,055,196 | – | – | 207,583,305 | 127,656,101 | – | – |
| Gross carrying amount | 82,048,277 | 52,055,196 | – | – | 207,583,305 | 127,656,101 | – | – |
| Neither Past Due Nor Individually Impaired |
||||||||
| Rating 0-4: Investment grade | 232,483,081 | 189,803,544 | 551,066 | 546,270 | 1,211,362 | 524,991 | 141,026,873 | 122,187,912 |
| Rating 5-6: Moderate risk | 176,917,981 | 164,134,382 | – | – | 11,740,339 | 9,954,491 | 210,169,138 | 172,174,168 |
| Gross carrying amount | 409,401,062 | 353,937,926 | 551,066 | 546,270 | 12,951,701 | 10,479,482 | 351,196,011 | 294,362,080 |
| Past Due But Not Individually Impaired |
||||||||
| Less than 3 months | 3,705,964 | 3,573,745 | – | – | – | – | – | – |
| 3 to 6 months | 1,868,823 | 1,047,562 | – | – | – | – | – | – |
| 6 to 12 months | 1,297,997 | 1,699,939 | – | – | – | – | – | – |
| 12 to 18 months | 1,326,904 | 1,177,750 | – | – | – | – | – | – |
| More than 18 months | 7,824,652 | 6,443,466 | – | – | – | – | – | – |
| Gross carrying amount | 16,024,340 | 13,942,462 | – | – | – | – | – | – |
| Individually Impaired | ||||||||
| Less than 3 months | 266,435 | 274,438 | – | – | – | – | – | – |
| 3 to 6 months | 1,007,795 | 611,771 | – | – | – | – | – | – |
| 6 to 12 months | 148,659 | 1,121,260 | – | – | – | – | – | – |
| 12 to 18 months | 734,831 | 417,687 | – | – | – | – | – | – |
| More than 18 months | 4,390,962 | 4,377,868 | – | – | – | – | – | – |
| Gross carrying amount | 6,548,682 | 6,803,024 | – | – | – | – | – | – |
| Total gross carrying amount | 514,022,361 | 426,738,608 | 551,066 | 546,270 | 220,535,006 | 138,135,583 | 351,196,011 | 294,362,080 |
| Provisional for Impairment | ||||||||
| Individual | 4,334,587 | 4,204,654 | – | – | – | – | – | – |
| Collective | 12,621,987 | 11,582,514 | – | – | – | – | – | – |
| Total Provision for impairment | 16,956,574 | 15,787,168 | – | – | – | – | – | – |
| Total net carrying amount | 497,065,787 | 410,951,440 | 551,066 | 546,270 | 220,535,006 | 138,135,583 | 351,196,011 | 294,362,080 |
The methodology of the impairment assessment is explained in the Note 5.3.10 on page 291.
65.1.1 (c) Credit Risk Exposure for Each Internal Credit Rating
Through adoption of a robust risk grading system that falls in line with Basel requirements, the Bank maintains accurate and consistent risk ratings across the credit portfolio in accordance with the established policy framework to ensure the quality of its credit portfolio. The risk rating framework consists of several ratings of varying degrees of risk as an indicator for Lending Officers to evaluate the overall risk profile of counterparties and to arrive at an acceptable risk return trade-off. It also provides a tool for the Management to assess the credit exposures across all lines of business, geographic regions and products. The risk ratings of the borrowers are reviewed at least annually or more frequently in a deteriorating risk profile of the counterparties.
The Bank’s internal credit rating of the loans and receivables to banks and loans and receivables to other customers together with historical default rates and respective gross carrying amounts are given in the table below:
| As at December 31, | 2014 | 2013 | ||
| Bank’s Internal Credit Rating | Historical Default Rates |
Gross Carrying Amount |
Historical Default Rates |
Gross Currying Amount |
| % | Rs. ’000 | % | Rs. ’000 | |
Neither Past Due Nor Impaired |
||||
| Government Guaranteed | – | 82,048,277 | – | 52,055,196 |
| Gold | 15.77 | 2,348,767 | 28.74 | 7,069,762 |
| Investment Grade | ||||
| Rating - 0 | 0.15 | 49,585,111 | 0.08 | 26,787,105 |
| Rating - 1 | 0.40 | 5,432,532 | 0.70 | 7,201,587 |
| Rating - 2 | 0.39 | 17,259,834 | 0.52 | 14,240,462 |
| Rating - 3 | 0.59 | 50,123,205 | 0.70 | 42,328,959 |
| Rating - 4 | 0.31 | 107,733,631 | 0.31 | 92,175,669 |
| Moderate Risk | ||||
| Rating - 5 | 0.88 | 154,362,496 | 1.09 | 139,356,308 |
| Rating - 6 | 1.68 | 22,555,485 | 1.79 | 24,778,073 |
Past Due But Not Impaired |
||||
| High Risk | ||||
| Rating - S | 25.27 | 2,593,132 | 26.30 | 1,926,738 |
| Extreme Risk | ||||
| Rating - 7 | 58.02 | 1,854,792 | 58.47 | 2,171,596 |
| Rating - 8 | 69.04 | 1,774,810 | 74.49 | 1,623,325 |
| Rating - 9 | 100.00 | 9,801,607 | 100.00 | 8,220,804 |
| Impaired | ||||
| Individually Impaired(*) | – | 6,548,682 | – | 6,803,024 |
| Total | – | 514,022,361 | – | 426,738,608 |
(*) Default rates are not calculated for individually impaired loans and receivables.
65.1.1 (d) Credit Quality by Class of Financial Assets
The tables below show the credit quality by the class of asset for all financial assets exposed to credit risk, based on the Bank’s internal
credit rating.
| As at December 31, 2014 | Neither Past Due Nor Individually Impaired | ||||||
| Note | Government Guarantee | Investment Grade | Moderate Risk | Past Due But Not Individually Impaired | Individually Impaired |
Total | |
| Rs. ’000 | Rs. ’000 | Rs. ’000 | Rs. ’000 | Rs. ’000 | Rs. ’000 | ||
| Cash and cash equivalents | 26 | – | 20,591,867 | – | – | – | 20,591,867 |
| Balances with Central Banks | 27 | 19,633,746 | – | – | – | – | 19,633,746 |
| Placements with banks | 28 | – | 14,507,861 | – | – | – | 14,507,861 |
| Derivative financial instruments | 29 | – | 459,510 | – | – | – | 459,510 |
| Other financial instruments - held-for-trading |
30 | 2,423,272 | 367,732 | 3,535,632 | – | – | 6,326,636 |
| Loans and receivables to banks | 31 | – | 551,066 | – | – | – | 551,066 |
| Loans and receivables to other customers |
32 | 82,048,277 | 231,625,228 | 174,801,951 | 6,376,232 | 2,214,099 | 497,065,787 |
| Corporate banking | 82,048,277 | 138,816,911 | 62,137,988 | 453,448 | 759,582 | 284,216,206 | |
| Amortised cost | 82,048,277 | 139,309,401 | 63,295,940 | 868,904 | 2,615,388 | 288,137,910 | |
| Less-provision for impairment | – | 492,490 | 1,157,952 | 415,456 | 1,855,806 | 3,921,704 | |
| Personal banking | – | 92,808,317 | 112,663,963 | 5,922,784 | 1,454,517 | 212,849,581 | |
| Amortised cost | – | 93,173,680 | 113,622,041 | 15,155,436 | 3,933,294 | 225,884,451 | |
| Less-provision for impairment | – | 365,363 | 958,078 | 9,232,652 | 2,478,777 | 13,034,870 | |
| Financial investments - Available-for-sale |
33 | 205,160,033 | 843,630 | 8,204,707 | – | – | 214,208,370 |
| Government Securities | 205,160,033 | – | 8,204,707 | – | – | 213,364,740 | |
| Equity Securities - Quoted shares |
– | 185,132 | – | – | – | 185,132 | |
| Equity Securities - Unquoted shares |
– | 45,057 | – | – | – | 45,057 | |
| Investment in unit trust | – | 613,441 | – | – | – | 613,441 | |
| Total | 309,265,328 | 268,946,894 | 186,542,290 | 6,376,232 | 2,214,099 | 773,344,843 | |
Definition of ‘Past Due’ - The Bank considers that any amount uncollected one day or more beyond their contractual due date as ‘Past Due’.
(*) Investment in Sri Lanka Development Bonds and Securities purchased under re-sale agreements included.
| As at December 31, 2013 | Neither Past Due Nor Individually Impaired | ||||||
| Note | Government Guarantee | Investment Grade | Moderate Risk | Past Due But Not Individually Impaired | Individually Impaired | Total | |
| Rs. ’000 | Rs. ’000 | Rs. ’000 | Rs. ’000 | Rs. ’000 | Rs. ’000 | ||
| Cash and cash equivalents | 26 | – | 14,261,549 | – | – | – | 14,261,549 |
| Balances with Central Banks | 27 | 18,431,936 | – | – | – | – | 18,431,936 |
| Placements with banks | 28 | – | 4,131,814 | – | – | – | 4,131,814 |
| Derivative financial instruments | 29 | – | 837,694 | – | – | – | 837,694 |
| Other financial instruments - held-for-trading |
30 | 4,058,644 | 334,407 | 1,986,007 | – | – | 6,379,058 |
| Loans and receivables to banks | 31 | – | 546,270 | – | – | – | 546,270 |
| Loans and receivables to other customers |
32 | 52,055,196 | 188,121,998 | 162,678,291 | 5,497,584 | 2,598,371 | 410,951,440 |
| Corporate banking | 52,055,196(*) | 119,616,050 | 51,951,240 | 270,864 | 1,014,209 | 224,907,559 | |
| Amortised cost | 52,055,196 | 120,812,047 | 52,332,386 | 828,160 | 3,092,875 | 229,120,664 | |
| Less - provision for impairment | – | 1,195,997 | 381,146 | 557,296 | 2,078,666 | 4,213,105 | |
| Personal banking | – | 68,505,948 | 110,727,051 | 5,226,720 | 1,584,162 | 186,043,881 | |
| Amortised cost | – | 68,991,497 | 111,801,996 | 13,114,301 | 3,710,150 | 197,617,944 | |
| Less - provision for impairment | – | 485,549 | 1,074,945 | 7,887,581 | 2,125,988 | 11,574,063 | |
| Financial investments - Available-for-sale |
33 | 123,597,457 | 190,584 | 7,968,484 | – | – | 131,756,525 |
| Government Securities | 123,597,457 | – | 7,968,484 | – | – | 131,565,941 | |
| Quoted shares | – | 145,492 | – | – | – | 145,492 | |
| Unquoted shares | – | 45,092 | – | – | – | 45,092 | |
| Investment in unit trust | – | – | – | – | – | – | |
| Total | 198,143,233 | 208,424,316 | 172,632,782 | 5,497,584 | 2,598,371 | 587,296,286 | |
Definition of ‘Past Due’ - The Bank considers that any amount uncollected one day or more beyond their contractual due date as ‘Past Due’.
(*) Investment made in Sri Lanka Development Bonds and Securities purchased under re-sale agreements included.
65.1.1 (e) Trading Assets
Held-for-Trading Investments in Debt and Equity Securities
The table below sets out the credit quality of debt and equity securities classified as held-for-trading. Debt securities include investments made by the Bank in Government Securities of Sri Lanka and Bangladesh. The analysis of equity securities is based on Fitch Rating Nomenclature or Equivalent Ratings, where applicable.
| As at December 31, | Note | 2014 | 2013 |
| Rs. ’000 | Rs. ’000 | ||
| Government Securities | |||
| Government Securities – Sri Lanka | |||
| Treasury bills | 781,287 | 2,946,147 | |
| Treasury bonds | 1,641,985 | 1,112,497 | |
| Government Securities – Bangladesh | |||
| Treasury bills | 3,442,876 | 1,842,431 | |
| Treasury bonds | 92,756 | 143,576 | |
| Total - Government securities | 5,958,904 | 6,044,651 | |
| Equity Shares | |||
| Rated AAA | 58,063 | 73,311 | |
| Rated AA- to AA+ | 5,923 | 4,310 | |
| Rated A to A+ | 41,018 | 16,316 | |
| Rated BBB+ | 7,545 | 4,413 | |
| Unrated | 255,183 | 236,057 | |
| Total - Equity securities | 367,732 | 334,407 | |
| Total | 30 | 6,326,636 | 6,379,058 |
Credit Exposure Arising from Derivative Transactions
Credit risk arising from derivative financial instruments at any time is limited to those with positive fair values, as reported in the Statement of Financial Position. With gross settled derivatives, the Bank is also exposed to a settlement risk, being the risk that counterparty fails to deliver the counter value.
The table below shows analysis of credit exposures arising from derivative financial assets and liabilities as at December 31, 2014.
| Derivative Type | ||||||||
| Total | Forward | SWAPS | Spot | |||||
| Notional Amount |
Fair Value |
Notional Amount |
Fair Value |
Notional Amount |
Fair Value |
Notional Amount |
Fair Value |
|
| Rs. ’000 | Rs. ’000 | Rs. ’000 | Rs. ’000 | Rs. ’000 | Rs. ’000 | Rs. ’000 | Rs. ’000 | |
| Derivative financial assets (Note 1) | 60,511,385 | 459,510 | 20,358,635 | 233,300 | 37,306,791 | 222,533 | 2,845,959 | 3,677 |
| Derivative financial liabilities (Note 2) | 69,110,246 | (1,193,139) | 8,222,097 | (368,886) | 60,338,932 | (823,596) | 549,217 | (657) |
| Note 1 | ||||||||
| Derivative financial assets by counterparty type |
||||||||
| With Banks | 45,727,744 | 279,671 | 6,328,908 | 54,701 | 37,306,791 | 222,533 | 2,092,045 | 2,437 |
| Other customers | 14,783,641 | 179,839 | 14,029,727 | 178,599 | – | – | 753,914 | 1,240 |
| 60,511,385 | 459,510 | 20,358,635 | 233,300 | 37,306,791 | 222,533 | 2,845,959 | 3,677 | |
| Note 2 | ||||||||
| Derivative financial liabilities by counterparty type |
||||||||
| With Banks | 64,423,203 | (848,596) | 3,747,560 | (24,499) | 60,338,932 | (823,596) | 336,711 | (501) |
| Other customers | 4,687,043 | (344,543) | 4,474,537 | (344,387) | – | – | 212,506 | (156) |
| 69,110,246 | (1,193,139) | 8,222,097 | (368,886) | 60,338,932 | (823,596) | 549,217 | (657) | |
65.1.2 Impaired Loans and Receivables and Investment Debt Securities
The table below sets out a reconciliation of changes in the carrying amount of individually impaired loans and receivables:
| As at December 31, | 2014 | 2013 |
| Rs. ’000 | Rs. ’000 | |
| Impaired loans and receivables to other customers as at January 01, | 2,598,374 | 2,569,121 |
| Newly classified as impaired loans and receivables during the year | 628,790 | 1,226,078 |
| Net change in already impaired loans and receivables during the year | (100,073) | (781,949) |
| Net payment, write-off and recoveries and other movement during the year | (912,992) | (414,876) |
| Impaired loans and receivables to customers as at December 31, | 2,214,099 | 2,598,374 |
No impairment provision has been made for investment in debt securities as at December 31, 2014 (2013 - nil).
For methodology of the impairment assessment, refer Note 5.3.10 on impairment of financial assets carried at amortised cost on page 291.
For details of provision for impairment for loans and receivables to banks and loans and receivable to other customers, refer Notes 31 and 32 on page 322.
Set out below is an analysis of the gross and net carrying amounts of individually impaired loans and receivables to customers by risk rates:
| As at December 31, | 2014 | 2013 | ||
| Loans and Receivable to Customers | Loans and Receivable to Customers | |||
| Gross | Net | Gross | Net | |
| Rs. ’000 | Rs. ’000 | Rs. ’000 | Rs. ’000 | |
| Rating 0-4: Investment Grade | 144,010 | 103,374 | 102,363 | 47,120 |
| Rating 5-6: Moderate Risk | 550,610 | 335,272 | 551,473 | 250,186 |
| Rating S: High Risk | 198,333 | 184,071 | 215,859 | 125,665 |
| Rating 7-9: Extreme Risk | 5,655,729 | 1,591,382 | 5,933,329 | 2,175,403 |
| 6,548,682 | 2,214,099 | 6,803,024 | 2,598,374 | |
65.1.3 Collateral Held
Loan to Value Ratio of Residential Mortgage Lending
The table below stratifies credit exposures from mortgage loans and advances to retail customers by ranges of loan-to-value (LTV) ratio.
LTV is calculated as the ratio of the gross amount of the loan to the value of the collateral which is also used for the computation of Capital
Adequacy Ratios. The value of the collateral for residential mortgage loans are based on the forced sale value determined by professional valuers.
| As at December 31, | 2014 | 2013 | ||
| LTV Ratio | Rs. ’000 | Composition (%) | Rs. ’000 | Composition (%) |
| Less than 50% | 4,351,805 | 24.04 | 3,270,031 | 24.72 |
| 51 - 70% | 4,690,017 | 25.90 | 3,622,301 | 27.39 |
| 71 - 90% | 5,244,165 | 28.96 | 3,614,301 | 27.33 |
| 91 - 100% | 821,071 | 4.53 | 722,516 | 5.46 |
| More than 100%* | 3,001,235 | 16.57 | 1,996,500 | 15.10 |
| 18,108,293 | 100.00 | 13,225,649 | 100.00 | |
* LTV ratio of more than 100% was due to the inflated numerator resulted from subsequent disbursements made to the borrower which was compared against the initial fair value of the property, (the denominator).
Assets Obtained by taking the Possession of Collaterals
Repossession of collaterals, is resorted to in extreme situations where action is necessitated to recover the dues. The repossessed assets are disposed, in an orderly and transparent manner and the proceeds are used to reduce or recover the outstanding claim.
65.1.4 Concentrations of Credit Risk
By setting various concentration limits under different criteria within the established risk appetite framework (i.e., single borrower/group, industry sectors, product counterparty and country etc.), the Bank ensures that an acceptable level of risk diversification is maintained on an ongoing basis. These limits are continuously monitored and periodically reviewed by the Credit Policy Committee, the Executive Integrated Risk Management Committee and the Board Integrated Risk Management Committee, to capture the developments in market, political and economic environment both locally and internationally to strengthen the dynamic portfolio management practices and to provide an early warning on possible credit concentrations.
The maximum exposure to credit risk to the components of financial assets in the Statement of Financial Position as at December 31, broken down by industry sector and by geographical region of financial assets is given below:
65.1.4 (a) Industry-wise Distribution
| As at December 31, 2014 | Agriculture and Fishing |
Manufacturing | Tourism | Transport | Construction | Traders | New Economy |
Financial and Business Services |
Government | Infrastructure | Other Services |
Other Customers |
Total |
| Rs. ’000 | Rs. ’000 | Rs. ’000 | Rs. ’000 | Rs. ’000 | Rs. ’000 | Rs. ’000 | Rs. ’000 | Rs. ’000 | Rs. ’000 | Rs. ’000 | Rs. ’000 | Rs. ’000 | |
| Financial Assets | |||||||||||||
| Cash and cash equivalents |
– | – | – | – | – | – | – | 20,591,867 | – | – | – | – | 20,591,867 |
| Balances with Central Banks |
– | – | – | – | – | – | – | 19,633,746 | – | – | – | 19,633,746 | |
| Placements with banks |
– | – | – | – | – | – | – | 14,507,861 | – | – | – | – | 14,507,861 |
| Derivative financial assets |
25,308 | 4,397 | 306 | – | 32,984 | 255 | – | 366,871 | – | 620 | 6,823 | 21,946 | 459,510 |
| Other financial instruments – held-for-trading |
– | 177,415 | 11,856 | – | 20,850 | 33,821 | 19,954 | 51,817 | 5,958,904 | 52,019 | – | – | 6,326,636 |
| Government securities |
– | – | 5,958,904 | 5,958,904 | |||||||||
| Equity securities - Quoted shares |
– | 177,415 | 11,856 | – | 20,850 | 33,821 | 19,954 | 51,817 | – | 52,019 | – | – | 367,732 |
| Loans and receivables to banks |
551,066 | 551,066 | |||||||||||
| Loans and receivables to other customers |
43,581,619 | 53,623,161 | 16,888,688 | 12,940,410 | 40,351,177 | 59,869,481 | 6,209,585 | 35,738,751 | 82,495,573 | 15,590,465 | 39,830,241 | 89,946,636 | 497,065,787 |
| Government securities |
40,850,011 | 40,850,011 | |||||||||||
| Loans & advances* |
43,581,619 | 52,662,465 | 16,888,688 | 12,940,410 | 40,351,177 | 58,916,183 | 6,209,585 | 28,751,154 | 41,198,266 | 15,590,465 | 39,593,074 | 89,946,636 | 446,629,722 |
| Investment securities |
– | 960,696 | – | – | – | 953,298 | 6,987,597 | 447,296 | – | 237,167 | 9,586,054 | ||
| Financial investments - Available-for- sale |
– | 11,356 | – | – | – | – | – | 789,467 | 213,380,603 | – | 26,944 | – | 214,208,370 |
| Government securities |
– | – | – | – | – | – | – | – | 213,364,740 | – | – | – | 213,364,740 |
| Equity securities - Quoted shares |
– | 11,356 | – | – | – | – | – | 173,777 | – | – | – | – | 185,133 |
| Equity securities - Unquoted shares |
– | – | – | – | – | – | – | 2,250 | 15,863 | – | 26,944 | – | 45,057 |
| Unit trusts | – | – | – | – | – | – | – | 613,440 | – | – | – | – | 613,440 |
| Total | 43,606,927 | 53,816,329 | 16,900,850 | 12,940,410 | 40,405,011 | 59,903,557 | 6,229,539 | 72,597,700 | 321,468,826 | 15,643,104 | 39,864,008 | 89,968,582 | 773,344,843 |
| As at December 31, 2013 |
Agriculture and Fishing |
Manufacturing | Tourism | Transport | Construction | Traders | New Economy |
Financial and Business Services |
Government | Infrastructure | Other Services |
Other Customers |
Total |
| Rs. ’000 | Rs. ’000 | Rs. ’000 | Rs. ’000 | Rs. ’000 | Rs. ’000 | Rs. ’000 | Rs. ’000 | Rs. ’000 | Rs. ’000 | Rs. ’000 | Rs. ’000 | Rs. ’000 | |
| Financial Assets | |||||||||||||
| Cash and cash equivalents |
– | – | – | – | – | – | – | 14,261,549 | – | – | – | – | 14,261,549 |
| Balances with Central Banks |
– | – | – | – | – | – | – | 18,431,936 | – | – | – | 18,431,936 | |
| Placements with banks |
– | – | – | – | – | – | – | 4,131,814 | – | – | – | – | 4,131,814 |
| Derivative financial assets |
90,357 | 6,657 | 122 | 17 | – | 3 | – | 699,656 | – | – | 19,259 | 21,623 | 837,694 |
| Other financial instruments – held-for-trading |
– | 158,110 | 1,720 | – | 21,685 | 29,082 | 40,599 | 32,738 | 6,044,651 | 28,631 | 21,842 | – | 6,379,058 |
| Government securities |
– | – | 6,044,651 | 6,044,651 | |||||||||
| Equity securities - Quoted shares |
– | 158,110 | 1,720 | – | 21,685 | 29,082 | 40,599 | 32,738 | 28,631 | 21,842 | – | 334,407 | |
| Loans and receivables to banks |
– | – | – | – | – | – | – | 546,270 | – | – | – | – | 546,270 |
| Loans and receivables to other customers |
36,503,291 | 48,845,668 | 12,928,639 | 9,895,157 | 33,943,285 | 49,776,845 | 6,101,677 | 18,404,072 | 52,502,492 | 12,625,531 | 29,883,058 | 99,541,725 | 410,951,440 |
| Government securities |
– | – | – | – | – | – | – | – | 43,108,697 | – | – | – | 43,108,697 |
| Loans & advances* |
36,503,291 | 47,722,435 | 12,928,639 | 9,895,157 | 33,943,285 | 49,522,937 | 6,101,677 | 16,088,750 | 8,946,499 | 12,625,531 | 29,645,802 | 99,541,725 | 363,465,728 |
| Investment securities |
– | 1,123,233 | – | – | – | 253,908 | – | 2,315,322 | 447,296 | – | 237,256 | – | 4,377,015 |
| Financial investments - Available-for- sale |
– | – | – | – | – | – | – | 147,743 | 131,565,940 | 42,842 | – | – | 131,756,525 |
| Government securities |
– | – | – | – | – | – | – | – | 131,565,940 | – | – | – | 131,565,940 |
| Equity securities - Quoted shares |
– | – | – | – | – | – | – | 145,493 | – | – | – | – | 145,493 |
| Equity securities - Unquoted shares |
– | – | – | – | – | – | – | 2,250 | – | 42,842 | – | – | 45,092 |
| Unit trusts | – | – | – | – | – | – | – | – | – | – | – | – | – |
| Total | 36,593,648 | 49,010,435 | 12,930,481 | 9,895,174 | 33,964,970 | 49,805,930 | 6,142,276 | 38,223,842 | 208,545,019 | 12,697,004 | 29,924,159 | 99,563,348 | 587,296,286 |
(*) Industry wise loans and receivables appearing in the Note 32.1 (c) does not agree due to the impairment.
65.1.4 (b) Geographical Distribution of Loans and Receivables Portfolio
The Western Province has recorded a higher percentage of lending based on geographical distribution of the Bank’s lending portfolio. It has accounted for 74% (approximately) of total advances portfolio of the Bank as at December 31, 2014. Although, Western Province is vested with highest credit concentration, we believe that a sizeable portion of these lending has been utilised to facilitate industries scattered around the country. For example, most of the large corporates which have island-wide operations are being accommodated by the branches and Corporate Banking Division situated in the Western Province thus reflecting a fairly diversified geographical concentration on such borrowers.
As at December 31, 2014
| Location | Loans and receivables by product | ||||||||||||
| Overdraft Rs. ’000 |
Trade Finance Rs. ’000 |
Lease Receivables Rs. ’000 |
Credit card Rs. ’000 |
Pawning Rs. ’000 |
Staff Loans Rs. ’000 |
Housing Loans Rs. ’000 |
Personal Loans Rs. ’000 |
Long Term Loans Rs. ’000 |
Short Term Loans Rs. ’000 |
Bills of Exchange Rs. ’000 |
Securities Purchased Under Resale Agreements (Rev. Repo.) Rs. ’000 |
Total Rs. ’000 |
|
| Sri Lanka | |||||||||||||
| Central | 3,597,148 | 101,125 | 1,394,106 | 253,347 | 144,102 | – | 1,814,563 | 1,165,655 | 8,968,284 | 377,338 | 46,093 | – | 17,861,761 |
| Eastern | 694,683 | – | 265,758 | 57,678 | 73,238 | – | 222,426 | 347,563 | 1,386,989 | 39,441 | – | – | 3,087,776 |
| North Central | 629,465 | 101,423 | 935,383 | 66,909 | 14,389 | – | 371,416 | 282,964 | 2,548,677 | 220,747 | 22,533 | – | 5,193,906 |
| Northern | 1,476,474 | – | 465,942 | 66,899 | 534,999 | – | 473,853 | 453,957 | 2,337,898 | 21,598 | 1,988 | – | 5,833,608 |
| North Western | 3,104,692 | 248,329 | 1,683,351 | 206,582 | 234,631 | – | 2,160,393 | 1,141,875 | 8,439,507 | 477,588 | 8,507 | – | 17,705,455 |
| Sabaragamuwa | 2,431,968 | 95,459 | 947,590 | 117,882 | 99,293 | – | 1,432,771 | 651,940 | 3,303,445 | 238,764 | 9,637 | – | 9,328,749 |
| Southern | 3,812,054 | 866,546 | 1,808,851 | 225,498 | 149,548 | – | 3,303,663 | 1,796,194 | 8,272,388 | 191,654 | 24,891 | – | 20,451,287 |
| Uva | 754,494 | 4,219 | 567,142 | 65,392 | 50,375 | – | 1,126,814 | 413,966 | 2,068,858 | 78,252 | – | – | 5,129,512 |
| Western | 46,910,668 | 37,926,034 | 13,894,422 | 2,404,228 | 1,007,100 | 4,873,068 | 19,440,762 | 14,375,984 | 128,245,662 | 18,126,426 | 3,595,743 | 41,198,266 | 331,998,363 |
| Bangladesh | 4,089,012 | 1,906,658 | 184,585 | 52,085 | – | 132,023 | 125,585 | 266,094 | 8,515,342 | 11,272,274 | 3,495,647 | – | 30,039,305 |
| Total | 67,500,658 | 41,249,793 | 22,147,130 | 3,516,500 | 2,307,675 | 5,005,091 | 30,472,246 | 20,896,192 | 174,087,050 | 31,044,082 | 7,205,039 | 41,198,266 | 446,629,722 |
As at December 31, 2013
| Location | Loans and receivables by product | ||||||||||||
| Overdraft Rs. ’000 |
Trade Finance Rs. ’000 |
Lease Receivables Rs. ’000 |
Credit card Rs. ’000 |
Pawning Rs. ’000 |
Staff Loans Rs. ’000 |
Housing Loans Rs. ’000 |
Personal Loans Rs. ’000 |
Long Term Loans Rs. ’000 |
Short Term Loans Rs. ’000 |
Bills of Exchange Rs. ’000 |
Securities Purchased Under Resale Agreements (Rev. Repo.) Rs. ’000 |
Total Rs. ’000 |
|
| Sri Lanka | |||||||||||||
| Central | 2,610,622 | 80,531 | 1,412,923 | 240,321 | 430,567 | – | 1,562,966 | 984,494 | 6,521,992 | 625,131 | 33,958 | – | 14,503,505 |
| Eastern | 733,465 | – | 358,591 | 54,712 | 362,417 | – | 215,886 | 436,866 | 1,281,357 | 103,432 | – | – | 3,546,726 |
| North Central | 659,699 | 220,115 | 900,708 | 63,468 | 61,178 | – | 340,048 | 382,997 | 1,907,628 | 585,721 | 16,601 | – | 5,138,163 |
| Northern | 1,793,373 | 18,701 | 648,594 | 63,460 | 1,766,574 | – | 489,533 | 425,873 | 2,382,651 | 35,437 | 1,465 | – | 7,625,661 |
| North Western | 3,160,834 | 139,391 | 1,929,409 | 195,960 | 644,118 | – | 1,987,342 | 823,209 | 6,891,028 | 562,428 | 6,268 | – | 16,339,987 |
| Sabaragamuwa | 1,921,976 | 100,115 | 860,982 | 111,821 | 278,100 | – | 1,276,231 | 505,806 | 2,315,080 | 223,776 | 7,100 | – | 7,600,987 |
| Southern | 3,491,892 | 529,769 | 1,431,837 | 213,904 | 398,049 | – | 3,061,521 | 1,428,483 | 6,182,105 | 140,064 | 18,338 | – | 16,895,962 |
| Uva | 675,125 | 29,499 | 525,312 | 62,030 | 159,051 | – | 790,164 | 301,657 | 1,547,085 | 86,900 | – | – | 4,176,823 |
| Western | 49,969,917 | 40,679,508 | 12,670,399 | 2,280,609 | 2,669,409 | 3,715,533 | 17,073,061 | 9,988,578 | 94,060,736 | 14,977,600 | 2,649,081 | 8,946,499 | 259,680,930 |
| Bangladesh | 4,755,943 | 5,190,750 | 211,118 | 42,998 | – | 161,221 | 96,264 | 277,571 | 5,193,375 | 9,813,447 | 2,214,297 | – | 27,956,984 |
| Total | 69,772,846 | 46,988,379 | 20,949,873 | 3,329,283 | 6,769,463 | 3,876,754 | 26,893,016 | 15,555,534 | 128,283,037 | 27,153,936 | 4,947,108 | 8,946,499 | 363,465,728 |
Please refer the Note No. 32.1(a) for the Gross carrying amount of the Loans and Advances, Government securities and investments coming under loans and receivables not considered in the above distribution.
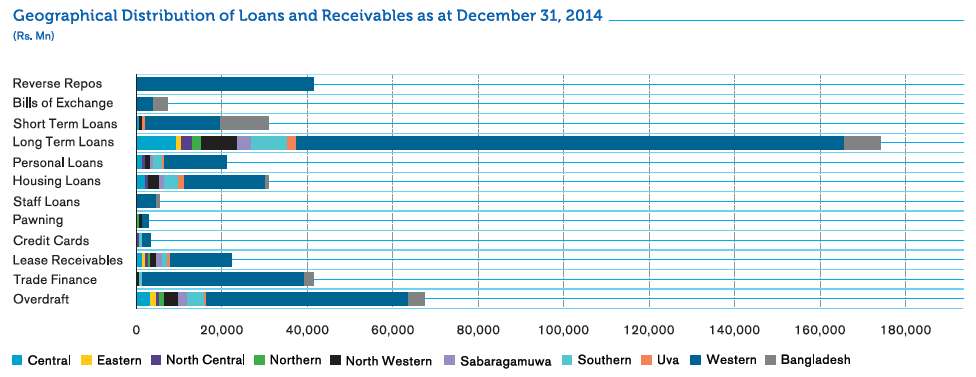
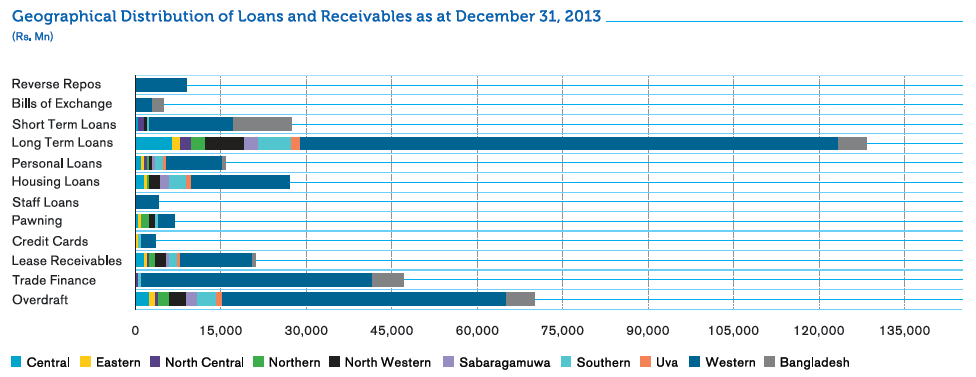
65.1.5 Exposures to Unrated Countries
This note summarises the Bank’s on-balance sheet and off-balance sheet exposure to unrated countries.
| As at December 31, | 2014 | 2013 |
| Rs. ’000 | Rs. ’000 | |
| On-Balance Sheet Exposures | ||
| Loans and receivables to customers | ||
| Net carrying value | 6,025,118 | 5,421,133 |
| Gross carrying value | 7,124,420 | 6,481,463 |
| Less - Provision for impairment | 1,099,302 | 1,060,330 |
| Fair value net of provision for impairment(*) | 6,025,118 | 5,421,133 |
| Fair value before impairment | 7,124,420 | 6,481,463 |
| Less - Provision for impairment | 1,099,302 | 1,060,330 |
| Off-Balance Sheet Exposures | ||
| Loan commitments and financial guarantees | 360,557 | 211,063 |
| Financial guarantees | 135,082 | 105,215 |
| Loan commitments | 225,475 | 105,848 |
| Total On-Balance sheet and off-balance sheet exposure | 6,385,675 | 5,632,196 |
(*) There is no difference between the net carrying amount and the fair value, as all facilities have been granted under floating interest rates.
65.2 Liquidity Risk
Liquidity risk is the Bank’s inability to meet On or Off-Balance Sheet contractual and contingent financial obligations, as they fall due without incurring unacceptable losses. The principal objective in liquidity risk management is to assess the need for funds to meet such obligations and to ensure the availability of adequate funding to fulfil those needs at the appropriate time, under both normal and stressed conditions.
Therefore, the Bank continuously analyses and monitors its liquidity profile, maintains adequate levels of high quality liquid assets, ensures access to diverse funding sources and has contingency funding agreements with peer banks to meet any unforeseen liquidity requirements. Exposures and ratios against tolerance limits as well as stressed scenarios are regularly monitored in order to identify the Bank’s liquidity position and potential funding requirements.
Asset and Liability Management Committee (ALCO)
ALCO chaired by the Managing Director, has representatives from Treasury, Corporate Banking, Personal Banking, Risk and Finance Departments. The Committee meets fortnightly or more frequently to monitor and manage the assets and liabilities of the Bank and also the overall liquidity position to keep the Bank’s liquidity at healthy levels, whilst satisfying the regulatory requirements.
65.2.1 Exposure to Liquidity Risk
The key measure used by the Bank for managing liquidity risk is the ratio of liquid assets to total liabilities excluding shareholders’ funds. For this purpose, ‘liquid assets’ include cash and cash equivalents, placements with banks and government securities (net). Details of the reported ratio of liquid assets to external liabilities of the Domestic Banking Unit (DBU) and the Off shore Banking Centre (OBC) as at the Reporting date are as follows:
| DBU | OBC | |||
| 2014 % |
2013 % |
2014 % |
2013 % |
|
| As at December 31, | 33.15 | 33.66 | 31.43 | 29.38 |
| Average for the period | 35.26 | 31.67 | 32.13 | 31.42 |
| Maximum for the period | 37.10 | 34.34 | 38.54 | 36.69 |
| Minimum for the period | 33.15 | 26.63 | 27.35 | 29.36 |
| Statutory minimum requirement | 20.00 | 20.00 | 20.00 | 20.00 |
The graph below depicts the trends in quarterly regulatory liquidity ratios of the Bank during the period from December 2012 to December 2014:
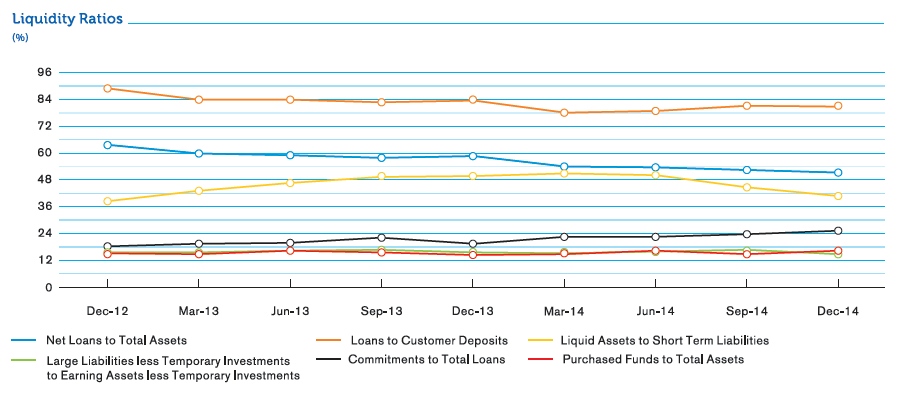
The ratio between net loans to total On-Balance Sheet assets has gradually reduced during the period while the ratio between total gross loans and advances to customer deposits has remained below 90%. Ratios of both purchased funds (including inter-bank and money market borrowings and institutional deposits) to total assets and large liabilities less temporary investments to earning assets less temporary investments have been well below 20%. The ratio of commitments to total loans has remained low. The ratio of liquid assets to short term liabilities has remained above 40%. All above ratios indicate strong liquidity position maintained by the Bank.
Liquidity Risk
62.2.2 Maturity Analysis of Financial Assets and Financial Liabilities
65.2.2 (a) Remaining Contractual Period to Maturity - Bank
(i) Remaining contractual period to maturity as at the date of Statement of Financial Position of the assets employed by the Bank is detailed below:
| As at December 31, | Up to 3 Months |
3 to 12 Months |
1 to 3 Years |
3 to 5 Years |
More than 5 Years |
Total as at 31.12.2014 |
Total as at 31.12.2013 |
| Rs. ’000 | Rs. ’000 | Rs. ’000 | Rs. ’000 | Rs. ’000 | Rs. ’000 | Rs. ’000 | |
| Interest earning assets: | |||||||
| Financial Assets | |||||||
| Cash and cash equivalents | 3,596,658 | – | – | – | – | 3,596,658 | 135,148 |
| Balances with Central Banks | 142,927 | 24,569 | – | – | – | 167,496 | 807 |
| Placements with banks | 13,450,661 | 1,057,200 | – | – | – | 14,507,861 | 4,131,814 |
| Derivative financial assets | – | – | – | – | – | – | – |
| Other financial instruments held-for-trading |
5,958,902 | – | – | – | – | 5,958,902 | 6,044,652 |
| Loans and receivables to banks | – | – | – | – | – | – | – |
| Loans and receivables to other customers |
206,309,889 | 91,849,961 | 114,254,729 | 57,920,186 | 26,731,022 | 497,065,787 | 410,951,440 |
| Financial investments - Available-for-sale | 14,825,840 | 43,143,743 | 30,542,371 | 72,261,471 | 52,591,316 | 213,364,741 | 131,707,597 |
| Financial investments - Held-to-maturity | – | – | – | – | – | – | – |
| Total interest earning assets as at 31.12.2014 |
244,284,877 | 136,075,473 | 144,797,100 | 130,181,657 | 79,322,338 | 734,661,445 | |
| Total interest earning assets as at 31.12.2013 |
222,773,731 | 128,191,095 | 124,442,293 | 53,925,344 | 23,638,995 | 552,971,458 | |
| Non-Interest earning assets: | |||||||
| Financial Assets | |||||||
| Cash and cash equivalents | 16,995,209 | – | – | – | – | 16,995,209 | 14,126,401 |
| Balances with Central Banks | 13,455,116 | 4,963,785 | 428,783 | 276,983 | 341,583 | 19,466,250 | 18,431,129 |
| Placements with banks | – | – | – | – | – | – | – |
| Derivative financial assets | 193,541 | 265,472 | 497 | – | – | 459,510 | 837,694 |
| Other financial instruments - held-for-trading |
367,734 | 367,734 | 334,406 | ||||
| Loans and receivables to banks | – | – | 551,066 | – | – | 551,066 | 546,270 |
| Loans and receivables to other customers |
– | – | |||||
| Financial investments – Available-for-sale | 613,440 | – | – | 15,864 | 214,325 | 843,629 | 48,928 |
| Financial investments – Held-to-maturity | – | – | – | – | – | – | – |
| Non-Financial Assets | |||||||
| Investments in subsidiaries | – | – | – | – | 1,211,000 | 1,211,000 | 288,946 |
| Investments in associates | – | – | – | – | 44,331 | 44,331 | 44,331 |
| Property, plant & equipment | – | – | – | – | 9,953,091 | 9,953,091 | 8,387,344 |
| Intangible assets | – | – | – | – | 439,128 | 439,128 | 467,593 |
| Leasehold property | – | – | – | – | 75,420 | 75,420 | 76,362 |
| Other assets | 6,559,320 | 199,018 | 479,974 | 985,799 | 2,317,706 | 10,541,817 | 9,426,730 |
| Total non-interest earning assets as at 31.12.2014 |
38,184,360 | 5,428,275 | 1,460,320 | 1,278,646 | 14,596,584 | 60,948,185 | |
| Total non-interest earning assets as at 31.12.2013 |
32,736,975 | 5,886,851 | 1,337,899 | 730,707 | 12,323,702 | 53,016,134 | |
| Total assets - as at 31.12.2014 | 282,469,237 | 141,503,748 | 146,257,420 | 131,460,303 | 93,918,922 | 795,609,630 | |
| Total assets - as at 31.12.2013 | 255,510,706 | 134,077,946 | 125,780,192 | 54,656,051 | 35,962,697 | 605,987,592 | |
| Percentage - as at 31.12.2014(*) | 35.51 | 17.79 | 18.38 | 16.52 | 11.80 | 100.00 | |
| Percentage - as at 31.12.2013(*) | 42.16 | 22.13 | 20.76 | 9.02 | 5.93 | 100.00 |
(*) Total percentage of each maturity bucket out of total assets employed by the Bank.
(ii) Remaining contractual period to maturity as at the date of Statement of Financial Position of the liabilities and shareholders’ funds employed by the Bank is detailed below:
| As at December 31, | Up to 3 Months |
3 to 12 Months |
1 to 3 Years |
3 to 5 Years |
More than 5 Years |
Total as at 31.12.2014 |
Total as at 31.12.2013 |
| Rs. ’000 | Rs. ’000 | Rs. ’000 | Rs. ’000 | Rs. ’000 | Rs. ’000 | Rs. ’000 | |
| Interest-bearing liabilities: | |||||||
| Financial Liabilities | |||||||
| Due to banks | 2,476,105 | 4,625,250 | – | – | – | 7,101,355 | 12,195,006 |
| Derivative financial liabilities | – | – | – | – | – | – | – |
| Other financial liabilities held-for-trading | – | – | – | – | – | – | – |
| Due to other customers/ Deposits from customers |
322,166,430 | 134,429,404 | 12,675,981 | 6,566,010 | 8,602,013 | 484,439,838 | 415,381,976 |
| Other borrowings | 84,342,793 | 41,530,330 | 6,907,267 | 2,244,110 | 1,176,582 | 136,201,082 | 54,173,175 |
| Subordinated liabilities | 132,370 | 128,721 | 972,660 | – | 9,811,024 | 11,044,775 | 10,944,412 |
| Total Interest-bearing liabilities as at 31.12.2014 |
409,117,698 | 180,713,705 | 20,555,908 | 8,810,120 | 19,589,619 | 638,787,050 | |
| Total interest-bearing liabilities as at 31.12.2013 |
305,094,129 | 141,567,740 | 14,342,812 | 11,467,136 | 20,222,752 | 492,694,569 | |
| Non-interest bearing liabilities: | |||||||
| Financial Liabilities | |||||||
| Due to banks | 18,159,621 | – | – | – | – | 18,159,621 | 1,999,213 |
| Derivative financial liabilities | 733,669 | 459,470 | – | – | – | 1,193,139 | 1,411,916 |
| Other financial liabilities held-for-trading | – | – | |||||
| Due to other customers/ Deposits form customers |
44,921,646 | – | – | – | – | 44,921,646 | 35,770,947 |
| Other borrowings | – | – | – | – | – | – | – |
| Non-Financial Liabilities | |||||||
| Current tax liabilities | 1,042,393 | 955,597 | – | – | – | 1,997,990 | 1,758,574 |
| Deferred tax liabilities | 241,710 | 229,566 | 674,822 | 954,790 | 472,872 | 2,573,760 | 1,563,070 |
| Other provisions | 1,874 | – | – | – | – | 1,874 | 2,409 |
| Other liabilities | 9,168,804 | 4,388,225 | 2,380,676 | 558,205 | 947,621 | 17,443,531 | 9,827,209 |
| Due to subsidiaries | 19,289 | – | – | – | – | 19,289 | 15,686 |
| Equity | |||||||
| Stated capital | – | – | – | – | 21,457,501 | 21,457,501 | 19,586,813 |
| Statutory reserves | – | – | – | – | 4,327,103 | 4,327,103 | 4,034,614 |
| Retained earnings | – | – | – | – | 4,258,287 | 4,258,287 | 4,233,364 |
| Other reserves | – | – | – | – | 40,468,839 | 40,468,839 | 33,089,208 |
| Total non-interest bearing liabilities as at 31.12.2014 |
74,289,006 | 6,032,858 | 3,055,498 | 1,512,995 | 71,932,223 | 156,822,580 | |
| Total non-interest bearing liabilities as at 31.12.2013 |
46,795,753 | 2,180,945 | 1,638,059 | 735,003 | 61,943,263 | 113,293,023 | |
| Total liabilities and equity - as at 31.12.2014 |
483,406,704 | 186,746,563 | 23,611,406 | 10,323,115 | 91,521,842 | 795,609,630 | |
| Total liabilities and equity - as at 31.12.2013 |
351,889,882 | 143,748,685 | 15,980,871 | 12,202,139 | 82,166,015 | 605,987,592 | |
| Percentage - as at 31.12.2014(*) | 60.76 | 23.47 | 2.97 | 1.30 | 11.50 | 100.00 | |
| Percentage - as at 31.12.2013(*) | 58.07 | 23.72 | 2.64 | 2.01 | 13.56 | 100.00 |
(*) Total percentage of each maturity bucket out of total liabilities and shareholders’ funds employed by the Bank.
65.2.2 (b) Non-derivative financial assets and financial liabilities expected to be recovered or settled after 12 months from the Reporting date
The table below sets out the carrying amounts of non-derivative financial assets and financial liabilities expected to be recovered or settled after 12 months from the Reporting date.
| As at December 31, | 2014 | 2013 |
| Rs. ’000 | Rs. ’000 | |
| Financial Assets | ||
| Non-Derivative Financial Assets | ||
| Balances with Central Banks | 1,047,349 | 944,248 |
| Loans and receivables to banks | 551,066 | 546,270 |
| Loans and receivables to other customers | 198,905,938 | 179,220,367 |
| Financial investments – Available-for-sale | 155,625,347 | 22,835,193 |
| 356,129,700 | 203,546,078 | |
| Financial Liabilities | ||
| Non-Derivative Financial Liabilities | ||
| Due to other customers/deposits from customers | 27,844,004 | 22,188,799 |
| Other borrowings | 10,327,959 | 13,146,467 |
| Subordinated liabilities | 10,783,684 | 10,797,660 |
| 48,955,647 | 46,132,926 |
65.2.3 Liquidity Reserves
The table below sets out the components of the Bank’s liquidity reserves:
| As at December 31, | 2014 | 2013 | ||
| Carrying Amount Rs. ’000 |
Fair Value Rs. ’000 |
Carrying Amount Rs. ’000 |
Fair Value Rs. ’000 |
|
| Balances with Central Banks | 19,633,746 | 19,633,746 | 18,431,936 | 18,431,936 |
| Cash and balances with other banks | 6,943,357 | 6,943,357 | 2,753,483 | 2,753,483 |
| Other cash and cash equivalents | 13,648,510 | 13,648,510 | 11,508,066 | 11,508,066 |
| Unencumbered debt securities issued by sovereigns | 119,194,940 | 116,655,967 | 91,166,713 | 91,902,859 |
| Total liquidity reserves | 159,420,553 | 156,881,580 | 123,860,198 | 124,596,344 |
65.2.4 Financial Assets Available to Support Future Funding
The table below sets out the availability of the Bank’s financial assets to support future funding:
| December 31, 2014 | Encumbered | Unencumbered | ||||
| Note | Pledged as Collateral Rs. ’000 |
Other* Rs. ’000 |
Available as Collateral Rs. ’000 |
Other Rs. ’000 |
Total Rs. ’000 |
|
| Cash and cash equivalents | 26 | 20,591,867 | 20,591,867 | |||
| Balances with Central Banks | 27 | 19,633,746 | 19,633,746 | |||
| Placements with banks | 28 | 14,507,861 | 14,507,861 | |||
| Derivative financial assets | 29 | 459,510 | 459,510 | |||
| Other financial instruments – Held-for-trading | 30 | 6,326,636 | 6,326,636 | |||
| Loans and receivables to banks | 31 | 551,066 | – | 551,066 | ||
| Loans and receivables to other customers | 32 | 497,065,787 | 497,065,787 | |||
| Financial investments – Available-for-sale | 33 | 124,564,499 | 89,643,871 | 214,208,370 | ||
| Total financial assets | 124,564,499 | 551,066 | 648,229,278 | – | 773,344,843 | |
| December 31, 2013 | Encumbered | Unencumbered | ||||
| Note | Pledged as Collateral Rs. ’000 |
Other* Rs. ’000 |
Available as Collateral Rs. ’000 |
Other Rs. ’000 |
Total Rs. ’000 |
|
| Cash and cash equivalents | 26 | 14,261,549 | 14,261,549 | |||
| Balances with Central Banks | 27 | 18,431,936 | 18,431,936 | |||
| Placements with banks | 28 | 4,131,814 | 4,131,814 | |||
| Derivative financial assets | 29 | 837,694 | 837,694 | |||
| Other financial instruments – Held-for-trading | 30 | 6,379,058 | 6,379,058 | |||
| Loans and receivables to banks | 31 | 546,270 | – | 546,270 | ||
| Loans and receivables to other customers | 32 | 410,951,440 | 410,951,440 | |||
| Financial investments – Available-for-sale | 33 | 39,230,639 | – | 92,525,886 | 131,756,525 | |
| Total financial assets | 39,230,639 | 546,270 | 547,519,377 | – | 587,296,286 | |
*Represents an amount where the Bank is prevented from exercising the right of lien against the claim made by the Bank due to a court action.
65.3 Market Risk
Market risk is the risk of losses in On or Off-Balance Sheet positions arising out of movements in prices affecting foreign exchange exposures, interest rate instruments, equity/debt instruments and commodity exposures. The Bank monitors market risk in both trading and non-trading portfolios.
65.3.1 Exposure to Market Risk - Trading and Non-Trading Portfolios
The table below sets out the allocation of assets and liabilities subject to market risk between trading and non-trading portfolios:
| As at December 31, 2014 | Market Risk Measurement | |||
| Note | Carrying Amount Rs. ’000 |
Trading Portfolios Rs. ’000 |
Non-Trading Portfolios Rs. ’000 |
|
| Assets Subject to Market Risk | ||||
| Cash and cash equivalents | 26 | 20,591,867 | – | 20,591,867 |
| Balances with Central Banks | 27 | 19,633,746 | – | 19,633,746 |
| Placements with banks | 28 | 14,507,861 | – | 14,507,861 |
| Derivative financial assets | 29 | 459,510 | 459,510 | – |
| Other financial instruments – Held-for-trading | 30 | 6,326,636 | 6,326,636 | – |
| Loans and receivables to banks | 31 | 551,066 | – | 551,066 |
| Loans and receivables to other customers | 32 | 497,065,787 | – | 497,065,787 |
| Financial investments – Available-for-sale | 33 | 214,208,370 | – | 214,208,370 |
| 773,344,843 | 6,786,146 | 766,558,697 | ||
| Liabilities Subject to Market Risk | ||||
| Due to banks | 40 | 25,260,976 | – | 25,260,976 |
| Derivative financial liabilities | 41 | 1,193,139 | 1,193,139 | – |
| Due to other customers/deposits from customers | 42 | 529,361,484 | – | 529,361,484 |
| Other borrowings | 43 | 136,201,082 | – | 136,201,082 |
| Subordinated liabilities | 49 | 11,044,775 | – | 11,044,775 |
| 703,061,456 | 1,193,139 | 701,868,317 | ||
| As at December 31, 2013 | Market Risk Measurement | |||
| Note | Carrying Amount Rs. ’000 |
Trading Portfolios Rs. ’000 |
Non-Trading Portfolios Rs. ’000 |
|
| Assets Subject to Market Risk | ||||
| Cash and cash equivalents | 26 | 14,261,549 | – | 14,261,549 |
| Balances with Central Banks | 27 | 18,431,936 | – | 18,431,936 |
| Placements with banks | 28 | 4,131,814 | – | 4,131,814 |
| Derivative financial assets | 29 | 837,694 | 837,694 | – |
| Other financial instruments – Held-for-trading | 30 | 6,379,058 | 6,379,058 | – |
| Loans and receivables to banks | 31 | 546,270 | – | 546,270 |
| Loans and receivables to other customers | 32 | 410,951,440 | – | 410,951,440 |
| Financial investments – Available-for-sale | 33 | 131,756,525 | – | 131,756,525 |
| 587,296,286 | 7,216,752 | 580,079,534 | ||
| Liabilities Subject to Market Risk | ||||
| Due to banks | 40 | 14,194,219 | – | 14,194,219 |
| Derivative financial liabilities | 41 | 1,411,916 | 1,411,916 | – |
| Due to other customers/deposits from customers | 42 | 451,152,923 | – | 451,152,923 |
| Other borrowings | 43 | 54,173,175 | – | 54,173,175 |
| Subordinated liabilities | 49 | 10,944,412 | – | 10,944,412 |
| 531,876,645 | 1,411,916 | 530,464,729 | ||
6.5.3.2 Exposure to Interest Rate Risk – Sensitivity Analysis
65.3.2 (a) Exposure to Interest Rate Risk – Non-Trading Portfolio
The possibility that changes in interest rates will affect future cash flows or the fair values of financial instruments gives rise to interest rate risk. The Bank’s policy is to continuously monitor portfolios and adopt hedging strategies to ensure that interest rate risk is maintained within prudent levels.
The tables below analyse the Bank’s interest rate risk exposure on financial assets and financial liabilities. The Bank’s assets and liabilities are included at carrying amount and categorised by the earlier of contractual re-pricing or maturity dates.
Interest rate gap position of the non-trading portfolio of the Bank is given below:
| As at December 31, 2014 | Up to 3 Months |
3 to 12 Months |
1 to 3 Years |
3 to 5 Years |
More than 5 Years |
Non- Sensitive |
Total as at 31.12.2014 |
| Rs. ’000 | Rs. ’000 | Rs. ’000 | Rs. ’000 | Rs. ’000 | Rs. ’000 | Rs. ’000 | |
| Financial Assets | |||||||
| Cash and cash equivalents | 1,000,000 | – | – | – | – | 19,591,867 | 20,591,867 |
| Balances with Central Banks | 167,497 | – | – | – | – | 19,466,249 | 19,633,746 |
| Placements with banks | 13,450,661 | 1,057,200 | – | – | – | – | 14,507,861 |
| Derivative financial assets | – | – | – | – | – | – | – |
| Other financial instruments – Held-for-trading | – | – | – | – | – | – | – |
| Loans and receivables to banks | – | – | – | – | – | 551,066 | 551,066 |
| Loans and receivables to other customers | 338,846,156 | 78,654,516 | 34,632,986 | 22,508,164 | 16,191,616 | 6,232,349 | 497,065,787 |
| Financial investments – Available-for-sale | 14,533,119 | 43,167,687 | 30,614,319 | 72,339,271 | 52,710,345 | 843,629 | 214,208,370 |
| Total Financial Assets | 367,997,433 | 122,879,403 | 65,247,305 | 94,847,435 | 68,901,961 | 46,685,160 | 766,558,697 |
| Financial Liabilities | |||||||
| Due to banks | 10,300,549 | 13,307,653 | – | – | – | 1,652,774 | 25,260,976 |
| Derivative financial liabilities | – | – | – | – | – | – | – |
| Due to other customers/deposits from customers |
141,378,207 | 134,432,410 | 12,187,265 | 5,977,239 | 190,344,790 | 45,041,573 | 529,361,484 |
| Other borrowings | 87,602,035 | 38,888,780 | 2,501,314 | 6,922,301 | 286,652 | – | 136,201,082 |
| Subordinated liabilities | 9,943,394 | 129,121 | 972,260 | – | – | – | 11,044,775 |
| Total Financial Liabilities | 249,224,185 | 186,757,964 | 15,660,839 | 12,899,540 | 190,631,442 | 46,694,347 | 701,868,317 |
| Interest rate sensitivity gap | 118,773,248 | (63,878,561) | 49,586,466 | 81,947,895 | (121,729,481) | (9,187) | 64,690,380 |
| As at December 31, 2013 | Up to 3 Months |
3 to 12 Months |
1 to 3 Years |
3 to 5 Years |
More than 5 Years |
Non- Sensitive |
Total as at 31.12.2013 |
| Rs. ’000 | Rs. ’000 | Rs. ’000 | Rs. ’000 | Rs. ’000 | Rs. ’000 | Rs. ’000 | |
| Financial Assets | |||||||
| Cash and cash equivalents | 135,147 | – | – | – | – | 14,126,402 | 14,261,549 |
| Balances with Central Banks | 734 | 73 | – | – | – | 18,431,129 | 18,431,936 |
| Placements with banks | 3,949,732 | 182,082 | – | – | – | – | 4,131,814 |
| Derivative financial assets | – | – | – | – | – | – | – |
| Other financial instruments – Held-for-trading | – | – | – | – | – | – | – |
| Loans and receivables to banks | – | – | – | – | – | 546,270 | 546,270 |
| Loans and receivables to other customers | 245,423,941 | 60,983,468 | 64,040,963 | 20,048,456 | 14,079,189 | 6,375,423 | 410,951,440 |
| Financial investments – Available-for-sale | 31,316,061 | 70,805,565 | 10,296,794 | 14,158,302 | 4,989,220 | 190,583 | 131,756,525 |
| Total Financial Assets | 280,825,615 | 131,971,188 | 74,337,757 | 34,206,758 | 19,068,409 | 39,669,807 | 580,079,534 |
| Financial Liabilities | |||||||
| Due to banks | 10,283,009 | 2,623,285 | – | – | – | 1,287,925 | 14,194,219 |
| Derivative financial liabilities | – | – | – | – | – | – | – |
| Due to other customers/deposits from customers |
132,786,909 | 124,310,803 | 7,784,257 | 5,880,920 | 144,523,072 | 35,866,962 | 451,152,923 |
| Other borrowings | 37,998,991 | 14,220,119 | 1,425,974 | 228,470 | 299,621 | – | 54,173,175 |
| Subordinated liabilities | 9,844,950 | 127,202 | 972,260 | – | – | – | 10,944,412 |
| Total Financial Liabilities | 190,913,859 | 141,281,409 | 10,182,491 | 6,109,390 | 144,822,693 | 37,154,887 | 530,464,729 |
| Interest rate sensitivity gap | 89,911,756 | (9,310,221) | 64,155,266 | 28,097,368 | (125,754,284) | 2,514,920 | 49,614,805 |
65.3.2 (b) Exposure to Interest Rate Risk – Non-Trading Portfolio (Rate Shocks)
The management of interest rate risk against interest rate gap limits is supplemented by monitoring the sensitivity of the Bank’s financial assets and financial liabilities to various interest rate scenarios.
The following table demonstrates the sensitivity of the Bank’s Income Statement as at Reporting date to a reasonable possible change in interest rates, with all other variables held constant.
| 2014 | 2013 | |||
| Net Interest Income (NII) | 100 bp Parallel Increase Rs. ’000 |
100 bp Parallel Decrease Rs. ’000 |
100 bp Parallel Increase Rs. ’000 |
100 bp Parallel Decrease Rs. ’000 |
| As at December 31, | 494,488 | (495,461) | 936,178 | (875,597) |
| Average for the period | 751,326 | (753,968) | 821,239 | (805,472) |
| Maximum for the period | 893,537 | (901,327) | 936,178 | (894,456) |
| Minimum for the period | 494,488 | (495,461) | 677,595 | (676,712) |
The Graph below depicts the impact on the Net Interest Income (NII) - Rate shock of 100 bp (on Rupee denominated) and 10 bp (on FCY denominated) Assets and Liabilities (Sri Lankan Operations):
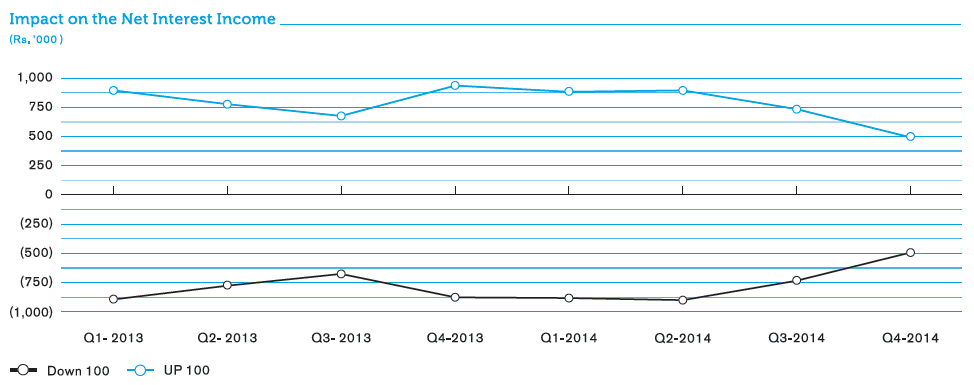
The impact of changes in interest rates on NII is measured using a static Balance Sheet which is subjected to 1% and 0.1% shocks on LKR and foreign currency asset and liability portfolios, respectively. Thereafter, the potential impact on the Bank’s profitability due to changes in LKR and foreign currency interest rates is evaluated to ensure that the variations are prudently managed within the internal tolerance limits. Above graph depicts the sensitivity of NII to rate shocks during the years 2013 and 2014. Right throughout 2014, the impact of rate shocks on projected NII has been well below the Management Action Trigger (MAT) limit. Since August, 2014 the impact has gradually decreased due to the conscious decision of the Bank to rebalance the Fixed Income Securities (FIS) portfolio.
65.3.3 Exposure to Currency Risk – Non-Trading Portfolio
Currency risk arises as a result of fluctuations in the value of a financial instrument due to changes in foreign exchange rates. There are set limits on position by currency and these positions are monitored on a daily basis.
The table below indicates the currencies to which the Bank had significant exposures as at December 31, 2014 and 2013 and the exposure as a percentage of the total capital funds:
Foreign Exchange Position as at December 31, 2014
| Currency | Spot | Forward | Net Open Position |
Net Position in Other Exchange Contracts |
Overall Exposure in Respective Foreign Currency |
Overall Exposure in LKR |
||||
| Assets | Liabilities | Net | Assets | Liabilities | Net | |||||
| 1 | 2 ’000 |
3 ’000 |
4=2-3 ’000 |
5 ’000 |
6 ’000 |
7=5-6 ’000 |
8 ’000 |
9 ’000 |
10 ’000 |
11 ’000 |
| United States Dollar | 22,916 | 22,921 | (5) | 6,974 | 2,804 | 4,170 | (5,132) | – | (967) | (127,730) |
| Great Britain Pound | 181 | 149 | 32 | 809 | 816 | (7) | (48) | – | (23) | (4,570) |
| Euro | 1,260 | 74 | 1,186 | 144 | 1,317 | (1,173) | 16 | – | 29 | (6,974) |
| Japanese Yen | 3,781 | 45,351 | (41,570) | 47,803 | 12,580 | 35,223 | 52 | – | (6,294) | – |
| Indian Rupee | – | – | – | – | – | – | – | – | – | – |
| Australian Dollars | 252 | 263 | (11) | 100 | 120 | (20) | (19) | – | (50) | (5,458) |
| Canadian Dollars | 124 | 216 | (92) | – | – | – | 55 | – | (37) | (4,166) |
| Other currencies in USD | 614 | 216 | 398 | 75 | 460 | (385) | 147 | – | 161 | 2,123 |
| Total exposure | USD (5,041) | USD (938) | (123,234) | |||||||
| Total capital funds as per the latest Audited Financial Statements (capital base of the Bank as at December 31, 2014) | 72,177,447 | |||||||||
| Total exposure as a percentage of total capital funds as per the latest Audited Financial Statements | (0.17%) | |||||||||
Foreign Exchange Position as at December 31, 2013
| Currency | Spot | Forward | Net Open Position |
Net Position in Other Exchange Contracts |
Overall Exposure in Respective Foreign Currency |
Overall Exposure in LKR |
||||
| Assets | Liabilities | Net | Assets | Liabilities | Net | |||||
| 1 | 2 ’000 |
3 ’000 |
4=2-3 ’000 |
5 ’000 |
6 ’000 |
7=5-6 ’000 |
8 ’000 |
9 ’000 |
10 ’000 |
11 ’000 |
| United States Dollar | 10,423 | 6,807 | 3,616 | 3,595 | 4,403 | (808) | 1,474 | – | 4,282 | 561,004 |
| Great Britain Pound | 812 | 54 | 758 | 100 | 906 | (806) | (34) | – | (82) | (17,707) |
| Euro | 920 | 186 | 734 | 100 | 832 | (732) | (4) | – | (1) | (238) |
| Japanese Yen | 13,172 | 12,356 | 816 | 10,537 | 16,922 | (6,385) | (155) | – | (5,724) | (7,149) |
| Indian Rupee | – | – | – | – | – | – | – | – | – | – |
| Australian Dollars | 640 | 177 | 463 | – | 475 | (475) | (38) | – | (50) | (5,900) |
| Canadian Dollars | 27 | 25 | 2 | – | – | – | – | – | 2 | 247 |
| Other currencies in USD | 273 | – | 273 | 36 | 295 | (259) | 125 | – | 138 | 18,131 |
| Total exposure | USD 1,502 | – | USD 4,186 | 548,388 | ||||||
| Total capital funds as per the latest Audited Financial Statements (capital base of the Bank as at December 31, 2013) | 65,579,876 | |||||||||
| Total exposure as a percentage of total capital funds as per the latest Audited Financial Statements | 0.84% | |||||||||
The Bank regularly conducts sensitivity analysis on Net Open Position (NOP) due to possible movements in the USD/LKR exchange rate to assess the exposure to Foreign Exchange Risk. An appropriate shock based on historical USD/LKR exchange rate is applied on the NOP which is measured against the Board approved thresholds.
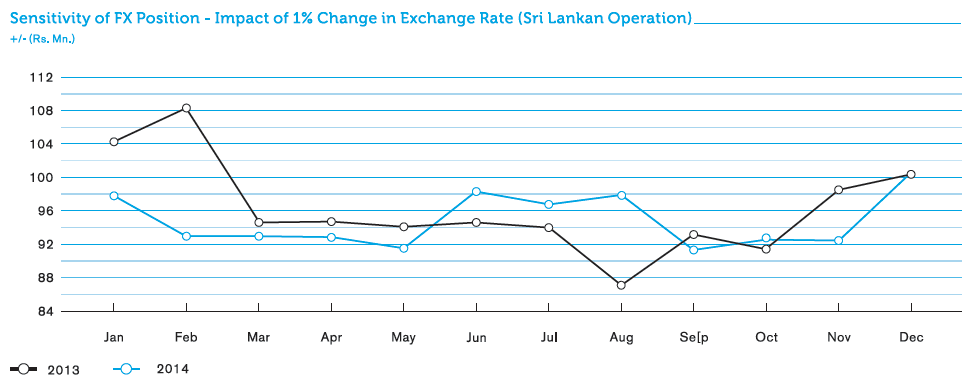
65.3.4 Exposure to Equity Price Risk
Impact on profit or loss and equity as a result of a change in market price by 10%.
Equity price risks result due to exposure to any change in prices and volatilities of individual equities. The Bank conducts mark-to-market calculations on a daily, quarterly and on a need basis to identify the impact due to changes in equity prices.
The table below summarises impact (both to the profit or loss and to the equity) due to a shock of 10% on equity price.
| Stress Level | 2014 | 2013 | ||||
| Held-for-Trading | Available-for-Sale | Total | Held-for-Trading | Available-for-Sale | Total | |
| Impact on P&L Rs. ’000 |
Impact on OCI Rs. ’000 |
Impact on Equity Rs. ’000 |
Impact on P&L Rs. ’000 |
Impact on OCI Rs. ’000 |
Impact on Equity Rs. ’000 |
|
| Shock of 10% on equity price (upward) | 36,773 | 18,513 | 55,286 | 33,441 | 14,549 | 47,990 |
| Shock of 10% on equity price (downward) | (36,773) | (18,513) | (55,286) | (33,441) | (14,549) | (47,990) |
65.4 Operational Risk
Operational risk is the risk of loss resulting from inadequate or failed internal processes, people and systems or from external events. Operational risk events which include legal and regulatory implications could lead to financial and reputation losses for the Bank.
The Operational Risk Management Framework of the Bank has been defined under the Board approved Operational Risk Management Policy. Operational risk is managed by establishing an appropriate internal control system that requires a mechanism for segregation of related responsibilities within the Bank, and a detailed testing and verification of the Bank’s overall operational systems, and achieving a full harmony between internal and external systems and establishing a fully independent back-up facility for Business Continuity Planning. For more details on ‘Operational Risk’ refer page 238 of the section on ‘Managing Risk at Commercial Bank’
65.5 Capital Management
Objective
The Bank is required to manage its capital taking into account the need to meet the regulatory requirements as well as the current and future business needs, stakeholder expectations and available options for raising capital.
65.5.1 Regulatory Capital
Capital Adequacy Ratio (CAR) is calculated based on the CBSL Directions stemming from Basel II Accord. These guidelines require the Bank to maintain a CAR of not less than 5% with core capital (Tier I) in relation to total risk weighted assets and a minimum overall CAR of 10% inclusive of Tier I and Tier II (Supplementary Capital) in relation to total risk-weighted assets.
| As at December 31, | 2014 | 2013 |
| Rs. ’000 | Rs. ’000 | |
| Tier I: Core Capital | ||
| Paid-up ordinary shares/Common stock/Assigned capital | 21,457,501 | 19,586,813 |
| Statutory reserve fund | 4,327,103 | 3,768,094 |
| Published Retained Profits/(Accumulated Losses) | 1,568,605 | 1,516,092 |
| General and other reserves | 32,010,399 | 27,079,104 |
| Minority interests (consistent with the above capital constituents) | – | – |
| Less: Deductions/Adjustments | ||
| Goodwill | – | – |
| Other intangible assets | 439,129 | 467,594 |
| Advances granted to employees of the Bank for the purchase of shares of the Bank (ESOP) | 786 | 1,122 |
| 50% of Investments in unconsolidated banking and financial subsidiary companies | 458,023 | – |
| 50% Investments in the capital of other banks and financial institutions | 402 | 402 |
| Total Eligible Core Capital (Tier I Capital) | 58,465,269 | 51,480,986 |
| Tier II: Supplementary Capital | ||
| Revaluation reserves (as approved by Central Bank of Sri Lanka) | 2,034,231 | 2,034,231 |
| General provisions | 1,836,058 | 1,656,465 |
| Approved subordinated term debt | 10,300,314 | 10,408,596 |
| Less: Deductions/Adjustments | ||
| 50% of investments in unconsolidated banking and financial subsidiary companies | 458,023 | – |
| 50% investments in the capital of other banks and financial institutions | 402 | 402 |
| Total eligible supplementary capital (Tier II Capital) | 13,712,178 | 14,098,890 |
| Total capital base | 72,177,447 | 65,579,876 |
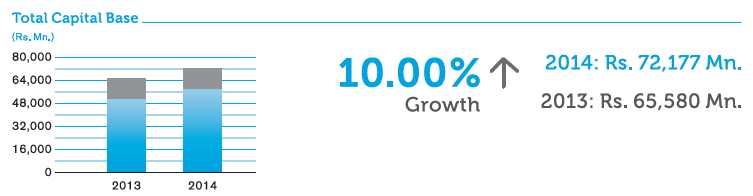
The Bank’s regulator, the Central Bank of Sri Lanka sets and monitors capital requirements for the Bank as a whole.
Historically the Bank has been maintaining a relatively higher CAR which reflects stability.
The higher level of capital maintained by the Bank has facilitated unhindered growth of the Bank.
The Bank has a well-structured Corporate Planning and Budgeting procedure. Capital budgeting decisions are arrived at after evaluating the impact of such decisions on the expansion of the Bank.
65.5.2 Capital Allocation
Management uses regulatory capital ratios to monitor its capital base. The allocation of capital between specific operations and activities is, to a large extent, driven by optimisation of the return achieved on the capital allocated. The amount of capital allocated to each operation or activity is based primarily on regulatory capital requirements, but in some cases the regulatory requirements do not fully reflect the varying degree of risk associated with different activities. In such cases, the capital requirements may be flexed to reflect differing risk profiles, subject to the overall level of capital to support a particular operation or activity not falling below the minimum requirements for regulatory purposes.
66. Events After The Reporting Period
No circumstances have arisen since the Reporting date which would require adjustments or disclosure in the Financial Statements other than those disclosed below.
66.1 ‘Super Gains Tax’ on profit
The Government of Sri Lanka, in its Interim Budget for 2015 presented to the Parliament on January 29, 2015, intimated that companies or individuals who have recorded a profit in excess of Rs. 2,000 Mn during the year of assessment 2013/14 would be liable to a one-off Super Gains Tax of 25%. The law enacting this proposal is currently being drafted and the basis of computing the liability is yet to be certified by the relevant authorities. In the absence of a measurement criteria for the computation of the Super Gains Tax which is not enacted or substantially enacted at the time of issue of these Financial Statements, the Bank is not in a position to estimate the potential impact of the said one-off tax on the Financial Statements for the year ended December 31, 2014 and therefore no provision has been made on account of the said tax in these Financial Statements.
The Bank will account for and meet the above tax liability as required by law once the required legislation is introduced and administered with the measurement criteria.
66.2 Interim Dividend - 2014
The Bank declared and paid a second interim dividend of Rs. 1.00 per share on February 05, 2015 to both the voting and non-voting ordinary shareholders of the Bank.
66.3 Final Dividend - 2014
The Board of Directors of the Bank has recommended the payment of a final dividend of Rs. 4.00 per share which consist of a cash dividend of Rs. 2.00 per share and the balance entitlement of Rs. 2.00 per share that will be satisfied in the form of issue and allotment of new shares for both the voting and non-voting ordinary shareholders of the Bank for the year ended December 31, 2014.
This dividend is yet to be approved at the Annual General Meeting to be held on March 31, 2015. In accordance with the Sri Lanka Accounting Standard No. 10, ‘Events after the Reporting Period’, this proposed final dividend has not been recognised as a liability as at December 31, 2014. Under the Inland Revenue Act No. 10 of 2006, a withholding tax of 10% has been imposed on dividends declared.
Compliance with Sections 56 and 57 of Companies Act No. 07 of 2007
As required by Section 56 of the Companies Act No. 07 of 2007, the Board of Directors of the Bank satisfied the solvency test in accordance with the Section 57, prior to recommending the final dividend. A statement of solvency completed and duly signed by the Directors on February 23, 2015 has been audited by KPMG.
66.4 New Employee Share Option Plan
The Board of Directors of the Bank at its meeting held on February 23, 2015 approved a proposal to introduce an ESOP for the benefit of all Executive Officers in Grade 1A and above by creating up to 2% of the ordinary voting shares at the rates specified in the proposed ESOP in 2016, 2017, 2018, upon the Bank achieving specified performance targets set for the years 2015, 2016 and 2017 respectively in the proposed ESOP. An Extraordinary General Meeting (EGM) is to be held on March 31, 2015, soon after the conclusion of the 46th Annual General Meeting of the Bank to seek approval of the shareholders for the proposed ESOP.